Page 139 - MC14326 all pages
P. 139

The South African Insurance Industry Survey 2016 | 135

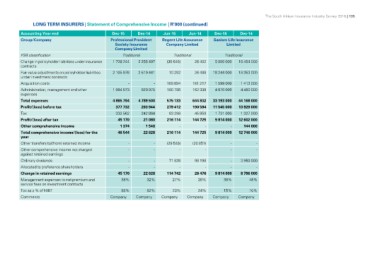
LONG TERM INSURERS | Statement of Comprehensive Income | R’000 (continued)

Accounting Year end                                 Dec-15         Dec-14       Jun-15       Jun-14       Dec-15          Dec-14
Group/Company
                                                    Professional Provident      Regent Life Assurance     Sanlam Life Insurance
FSB classification                                     Society Insurance           Company Limited                  Limited
Change in policyholder liabilities under insurance     Company Limited
contracts
Fair value adjustments on policyholder liabilities  Traditional                 Traditional                      Traditional
under investment contracts                                                                                5 000 000 16 464 000
Acquisition costs                                   1 728 244 2 255 497         (36 646)     26 402
Administration, management and other
expenses                                            2 105 976 2 519 441         10 292       26 488 18 244 000 18 353 000
Total expenses
Profit/(loss) before tax                                        -           -   169 894      181 217      1 599 000       1 413 000
Tax                                                 1 084 073      829 975      180 796      162 338      4 870 000       4 460 000
Profit/(loss) after tax
Other comprehensive income                          4 865 794      4 789 500    575 133      644 832      33 193 000      44 168 000
Total comprehensive income/(loss) for the             377 732        263 944    279 412      190 584      11 545 000      13 929 000
year                                                  332 562        242 864
Other transfers to/(from) retained income               45 170         21 080    63 298       45 859       1 731 000       1 327 000
Other comprehensive income not charged                   1 374          1 548   216 114      144 725       9 814 000      12 602 000
against retained earnings                               46 544         22 628
Ordinary dividends                                                                       -            -                -      144 000
Allocated to preference shareholders                                            216 114      144 725       9 814 000      12 746 000
Change in retained earnings
Management expenses to net premium and                      - - (29 546) (20 051) - -
service fees on investment contracts                        ------
Tax as a % of NIBT
Comments                                                    -              -     71 826      98 198                   -   3 950 000
                                                            -              -             -           -                -               -
                                                    45 170         22 628                                 9 814 000
                                                      38%            32%        114 742      26 476             38%       8 796 000
                                                                                    27%        26%                              48%

                                                            88%            92%          23%          24%          15%             10%
                                                    Company        Company      Company      Company      Company         Company
   134   135   136   137   138   139   140   141   142   143   144