Page 135 - MC14326 all pages
P. 135

The South African Insurance Industry Survey 2016 | 131

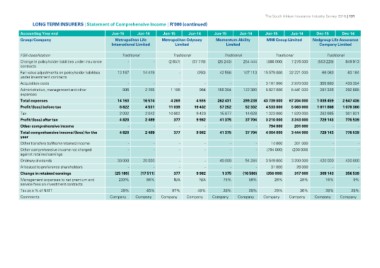
LONG TERM INSURERS | Statement of Comprehensive Income | R’000 (continued)

Accounting Year end                                 Jun-15       Jun-14       Jun-15       Jun-14       Jun-15       Jun-14       Jun-15       Jun-14       Dec-15         Dec-14
Group/Company
                                                      Metropolitan Life       Metropolitan Odyssey      Momentum Ability          MMI Group Limited         Nedgroup Life Assurance
                                                    International Limited               Limited                 Limited                                          Company Limited

FSB classification                                  Traditional               Traditional               Traditional               Traditional               Traditional
Change in policyholder liabilities under insurance
contracts                                                   -              -  (2 657)      (37 778)     (25 240)     254 444      (586 000) 7 276 000       (553 229)      849 913
Fair value adjustments on policyholder liabilities
under investment contracts                          13 167       14 419               -    (250)        42 586       107 113 15 579 000 32 221 000          66 063         63 184
Acquisition costs
Administration, management and other                    ---                                         -           -            - 3 101 000 2 970 000          355 889        433 354
expenses                                            996 2 155 1 106
Total expenses                                                                             964 156 384 122 380 5 827 000 5 441 000 281 326 292 695
Profit/(loss) before tax
Tax                                                 14 163       16 574        4 269        4 555       262 431      299 238      43 739 000   67 204 000   1 038 459      2 647 436
Profit/(loss) after tax                              6 822        4 531       11 039       19 402        57 252       52 332       4 533 000    5 063 000   1 011 808      1 078 360
Other comprehensive income                           2 002        2 042       10 662                     15 877       14 628       1 323 000    1 820 000
Total comprehensive income/(loss) for the            4 820        2 489                     9 420        41 375       37 704       3 210 000    3 243 000     282 665        301 821
year                                                        -            -        377       9 982                -            -       794 000      201 000    729 143        776 539
Other transfers to/(from) retained income            4 820        2 489               -                  41 375       37 704       4 004 000    3 444 000
Other comprehensive income not charged                                                             -                                                                    -              -
against retained earnings                                                         377       9 982                                                             729 143        776 539
Ordinary dividends
Allocated to preference shareholders                        -              -          -             -           -            -    14 000       301 000              -                     -
Change in retained earnings
Management expenses to net premium and                      - - - - - - (794 000) (200 000) - -
service fees on investment contracts
Tax as a % of NIBT                                    30 000       20 000             -             -   40 000       54 284 3 549 000 3 200 000             420 000        420 000
Comments                                                      -            -
                                                                                      - - - - 31 000 28 000 - -
                                                    (25 180)     (17 511)
                                                       233%          84%      377          9 982        1 375        (16 580) (356 000)        317 000      309 143        356 539

                                                                              N/A N/A 75% 58% 28% 28% 16% 9%

                                                            29%          45%          97%          49%          28%          28%          29%          36%          28%            28%
                                                    Company      Company      Company      Company      Company      Company      Company      Company      Company        Company
   130   131   132   133   134   135   136   137   138   139   140