Page 137 - MC14326 all pages
P. 137

The South African Insurance Industry Survey 2016 | 133

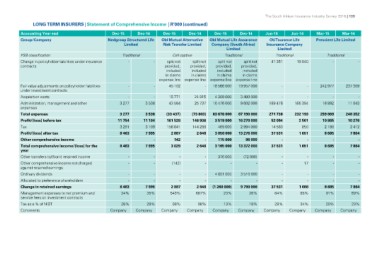
LONG TERM INSURERS | Statement of Comprehensive Income | R’000 (continued)

Accounting Year end                                 Dec-15       Dec-14       Dec-15           Dec-14           Dec-15           Dec-14           Jun-15       Jun-14       Mar-15       Mar-14
Group/Company
                                                    Nedgroup Structured Life  Old Mutual Alternative            Old Mutual Life Assurance           OUTsurance Life         Prescient Life Limited
FSB classification                                              Limited        Risk Transfer Limited             Company (South Africa)           Insurance Company
Change in policyholder liabilities under insurance                                                                           Limited
contracts                                                                                                                                                 Limited

Fair value adjustments on policyholder liabilities  Traditional               Cell captive                      Traditional                       Traditional               Traditional
under investment contracts                              -                                                                                                                       -
Acquisition costs                                                        -          split not        split not        split not        split not  41 351       19 840                                     -
Administration, management and other                                              provided,        provided,        provided,        provided,
expenses                                                                           included         included         included         included
Total expenses                                                                     in claims        in claims        in claims        in claims
Profit/(loss) before tax                                                      expense line     expense line     expense line     expense line
Tax
Profit/(loss) after tax                                     --                45 102                   -        18 566 000 19 957 000                     - - 242 977 237 309
Other comprehensive income
Total comprehensive income/(loss) for the                 -            -      15 771           24 915            4 309 000       3 480 000                 -            -           -            -
year                                                3 277        3 538        43 584           25 737           10 476 000       9 602 000        189 476      185 394      16 892       11 043
Other transfers to/(from) retained income
Other comprehensive income not charged               3 277        3 538       (33 437)         (73 803)         83 676 000       87 190 000       271 738      232 193      259 869      248 352
against retained earnings                           11 754       11 104       161 528          146 936           3 519 000       16 270 000        52 094         2 501      10 865       10 276
Ordinary dividends                                                            158 641          144 288              469 000                        14 563           850        2 180        2 412
Allocated to preference shareholders                 3 291        3 109                                          3 050 000        2 994 000        37 531         1 651        8 685        7 864
Change in retained earnings                          8 463        7 995          2 887            2 648             115 000      13 276 000                -            -            -            -
Management expenses to net premium and                                              142                  -       3 165 000                         37 531         1 651        8 685        7 864
service fees on investment contracts                        -            -                                                            96 000
Tax as a % of NIBT                                   8 463        7 995          3 029            2 648                          13 372 000
Comments
                                                            - - - - 376 000 (72 000)                                                                      ----
                                                            - - (142) - - -                                                                               - 17 - -

                                                          -            -             -                -           4 801 000      3 510 000                -          -            -            -
                                                          -            -             -                -                       -              -            -          -            -            -
                                                    8 463        7 995        2 887            2 648                                              37 531       1 668        8 685        7 864
                                                     34%          35%         543%             687%             (1 260 000)      9 790 000          64%         85%          91%          69%
                                                                                                                        23%            26%

                                                            28%          28%          98%              98%              13%              18%              28%          34%          20%          23%
                                                    Company      Company      Company          Company          Company          Company          Company      Company      Company      Company
   132   133   134   135   136   137   138   139   140   141   142