Page 133 - MC14326 all pages
P. 133

The South African Insurance Industry Survey 2016 | 129

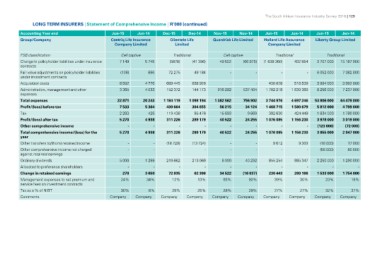
LONG TERM INSURERS | Statement of Comprehensive Income | R’000 (continued)

Accounting Year end                                 Jun-15       Jun-14        Dec-15         Dec-14         Nov-15         Nov-14       Jun-15         Jun-14         Jun-15         Jun-14
Group/Company
                                                    Centriq Life Insurance     Clientele Life                Guardrisk Life Limited      Hollard Life Assurance        Liberty Group Limited
                                                      Company Limited             Limited                                                   Company Limited

FSB classification                                  Cell captive               Traditional                   Cell captive                Traditional                          Traditional
Change in policyholder liabilities under insurance                                                                                                                     3 707 000 15 187 000
contracts                                           7 149         5 745        (5878)         (41 396)       49 502         (66 975)     (1 638 360)    432 854
Fair value adjustments on policyholder liabilities
under investment contracts                          (138)         886 72 275 49 184                                  -               -           -               - 6 052 000 7 382 000
Acquisition costs
Administration, management and other                6 582         4 776        689 445        658 926                 -              -     430 028        516 539      3 994 000      3 992 000
expenses                                            3 365         4 033        152 372        144 173        916 282        537 404      1 702 218      1 630 360      8 256 000      7 237 000
Total expenses
Profit/(loss) before tax                            22 871        20 243       1 184 119      1 098 194      1 382 562      756 902      3 744 976      4 697 246      53 806 000     64 479 000
Tax                                                  7 533         5 364         430 664        384 655          56 215      34 124      1 468 715      1 580 679       5 812 000      4 799 000
Profit/(loss) after tax                              2 263            426        119 438          95 476         15 693        9 869                                    1 834 000      1 780 000
Other comprehensive income                           5 270         4 938         311 226        289 179          40 522      24 255        392 630        424 449       3 978 000      3 019 000
Total comprehensive income/(loss) for the                   -             -                -              -              -           -   1 076 085      1 156 230        (123 000)       (72 000)
year                                                 5 270         4 938         311 226        289 179          40 522      24 255                                     3 855 000      2 947 000
Other transfers to/(from) retained income                                                                                                            -              -
Other comprehensive income not charged                                                                                                   1 076 085      1 156 230
against retained earnings
Ordinary dividends                                          -               - (18 729) (13 724)                      -               -   9 612          9 303          (16 000)       17 000
Allocated to preference shareholders
Change in retained earnings                                 -               -          -              -              -               -           -               - (56 000)           80 000
Management expenses to net premium and
service fees on investment contracts                5 000         1 288        219 662        213 069         6 000           40 292     855 254        885 347        2 250 000      1 290 000
Tax as a % of NIBT                                        -             -               -              -             -                -           -              -                 -              -
Comments
                                                      270         3 650         72 835         62 386        34 522         (16 037)     230 443        280 186        1 533 000      1 754 000
                                                     24%           34%             12%            13%          93%              92%          39%            30%              23%            18%

                                                            30%            8%          28%            25%            28%            29%          27%            27%            32%            37%
                                                    Company      Company       Company        Company        Company        Company      Company        Company        Company        Company
   128   129   130   131   132   133   134   135   136   137   138