Page 151 - MC14326 all pages
P. 151

The South African Insurance Industry Survey 2016 | 147

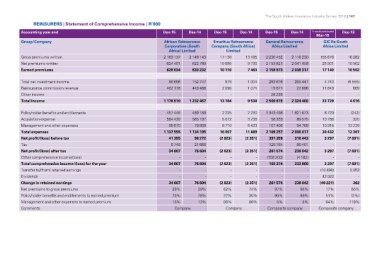
REINSURERS | Statement of Comprehensive Income | R’000

Accounting year end                                       Dec-15         Dec-14         Dec-15     Dec-14       Dec-15      Dec-14         15 month period ended  Dec-13

                                                                                                                                              Mar-15

Group/Company                                             African Reinsurance            Emeritus Reinsurance   General Reinsurance        GIC Re South
                                                          Corporation (South            Company (South Africa)      Africa Limited         Africa Limited
Gross premiums written
Net premiums written                                         Africa) Limited                       Limited
Earned premiums
                                                          2 163 137 2 146 143           17 130     13 185       2 230 452   2 116 230      155 878                16 282
                                                                                                                2 153 821   2 041 458       25 901                10 502
                                                          624 491        622 780        10 680     9 730        2 158 973   2 036 317       17 140                10 502

                                                          628 034        630 232        10 110     7 463

Total net investment income                                   88 698       152 747          979    1 004          293 676     265 447       4 740                 (6 555)
Reinsurance commission revenue                              462 178        449 488       2 095     1 071            19 671      22 696     11 849                     669
Other income                                                                                                        28 295              -                                 -
Total income                                                          -              -          -        -                                         -
                                                          1 178 910      1 232 467      13 184     9 538        2 500 615   2 324 460      33 729                  4 616

Policyholder benefits and entitlements                    457 446        489 189        2 225      2 230        1 943 498 1 821 673        8 729                  (242)
Acquisition expense
Management and other expenses                             584 439        565 197        5 072      3 236        58 353      89 575         10 788                 320
Total expenses
Net profit/(loss) before tax                              95 670         79 809         8 710      6 423        107 406     94 769         10 915                 12 229
Tax
Net profit/(loss) after tax                               1 137 555 1 134 195           16 007     11 889       2 109 257 2 006 017        30 432                 12 307
Other comprehensive income/(loss)
Total comprehensive income/(loss) for the year            41 355         98 272         (2 823)    (2 351)      391 358     318 443        3 297                  (7 691)
Transfer to/(from) retained earnings
Dividends                                                 6 748          21 668                 --              129 784     80 401         --
Change in retained earnings
Net premiums to gross premiums                            34 607         76 604         (2 823)    (2 351)      261 574     238 042        3 297                  (7 691)
Policyholder benefits and entitlements to earned premium
Management and other expenses to earned premium                   --                            --              (158 200)   (4 182)        --
Comments
                                                          34 607         76 604         (2 823)    (2 351)      103 374     233 860        3 297                  (7 691)

                                                                  --                            --                      --                 (10 496)               8 053

                                                                  --                            --                      --                 42 022                         -

                                                          34 607         76 604         (2 823)    (2 351)      261 574     238 042        (49 221)               362

                                                          29%            29%            62%        74%          97%         96%            17%                    65%

                                                          73%            78%            22%        30%          90%         89%            51%                    (2%)

                                                          15%            13%            86%        86%          5% 5%                      64%                    116%

                                                          Company                       Company                 Composite company          Composite company
   146   147   148   149   150   151   152   153   154   155   156