
Page 148 - MC14326 all pages
P. 148
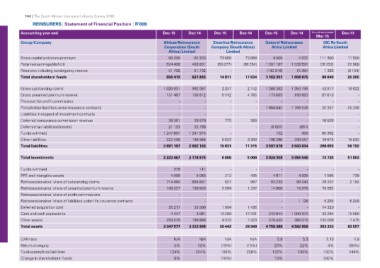
144 | The South African Insurance Industry Survey 2016 Dec-15 Dec-14 Dec-15 Dec-14 Dec-15 Dec-14 15 month period ended Dec-13
REINSURERS | Statement of Financial Position | R’000 Mar-15
Accounting year end African Reinsurance Emeritus Reinsurance General Reinsurance GIC Re South
Corporation (South Company (South Africa) Africa Limited Africa Limited
Group/Company
Africa) Limited Limited
Share capital and share premium
Retained earnings/(deficit) 80 300 80 300 73 888 73 888 4 000 4 000 111 500 11 500
Reserves including contingency reserve 1 301 167 1 039 591 (26 252) 22 969
Total shareholders' funds 524 408 489 801 (59 077) (56 254) (142 816) (9 104)
1 162 351 15 384 1 393 25 365
Gross outstanding claims 51 702 51 702 -- 1 058 975 86 640
Gross unearned premium reserve
Provision for profit commission 656 410 621 803 14 811 17 634
Policyholder liabilities under insurance contracts
Liabilities in respect of investment contracts 1 020 031 992 067 2 247 2 742 1 366 362 1 350 796 42 817 16 822
Deferred reinsurance commission revenue 151 467 156 612 6 112 4 785 173 603 180 863 87 613 -
Deferred tax liabilities/(assets) - - - -
Funds withheld - - - - -
Other liabilities - - - - 1 864 642 1 766 526 20 357 25 338
Total liabilities 28 361 - - - - - -
21 153 28 679 770 389 - - - -
Total investments 33 786 - - 16 839 -
1 247 697 1 241 975 - - (6 607) (867) -
Funds withheld 222 458 148 984 6 502 3 399 732 459 -
PPE and intangible assets 2 602 103 15 631 11 315 80 392 16 032
Retrocessionaires' share of outstanding claims 2 691 167 198 286 206 057 18 675 58 192
Retrocessionaires' share of unearned premium reserve 3 597 018 3 503 834 266 693
Retrocessionaires' share of profit commissions
Retrocessionaires' share of liabilities under life insurance contracts 2 223 467 2 174 975 6 005 5 000 3 824 358 3 084 546 73 725 51 803
Deferred acquisition cost
Cash and cash equivalents 378 141 - - - - - -
Other assets 4 006 5 083 212 495 4 811 4 926 1 585 739
Total assets 714 960 695 651 627 967 93 233 89 243 26 207 2 192
106 027 109 629 2 054 1 297 14 868 16 976 78 852
CAR ratio -
Return on equity - - - - - - - -
Total assets/total liabilities - - - - - 1 128 5 265 6 259
Change in shareholders' funds 35 217 35 500 1 904 1 436 - 14 329 -
4 447 3 061 10 268 12 431 242 644 - 33 284 15 089
259 075 199 866 9 372 7 323 579 455 1 000 975 120 086 7 475
3 347 577 3 223 906 30 442 28 949 4 759 369 353 333 83 557
365 015
4 562 809
N/A N/A N/A N/A 5,9 5,5 2,13 1,8
5% 12% (19%) (13%) 23% 22% 4% (30%)
124% 124% 195% 256% 132% 130% 132% 144%
6% (16%) 10% 242%