
Page 152 - MC14326 all pages
P. 152
148 | The South African Insurance Industry Survey 2016
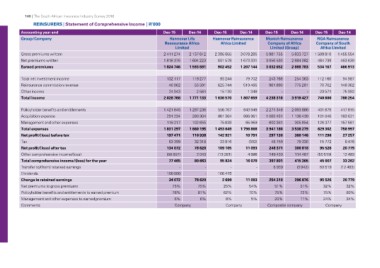
REINSURERS | Statement of Comprehensive Income | R’000
Accounting year end Dec-15 Dec-14 Dec-15 Dec-14 Dec-15 Dec-14 Dec-15 Dec-14
Group/Company
Hannover Life Hannover Reinsurance Munich Reinsurance RGA Reinsurance
Gross premiums written Reassurance Africa Africa Limited Company of Africa Company of South
Net premiums written
Earned premiums Limited Limited (Group) Africa Limited
2 411 274 2 137 612 2 395 855 3 078 265 5 981 755 5 633 727 1 509 810 1 455 554
601 578 1 673 331
1 818 376 1 604 223 902 452 1 207 144 3 056 530 2 884 082 484 739 463 639
1 824 746 1 593 681 3 032 652 2 888 783 534 167 466 913
Total net investment income 132 117 119 277 93 244 79 702 243 768 254 363 112 160 94 987
Reinsurance commission revenue 46 962 55 591 625 744 519 465 961 890 775 281 70 702 148 362
Other income 24 943 2 584 23 571
Total income 15 130 1 348 - - 75 992
2 028 768 1 771 133 1 636 570 1 807 659 4 238 310 3 918 427 740 600 786 254
Policyholder benefits and entitlements 1 421 846 1 297 236 556 707 843 948 2 271 348 2 093 886 401 879 417 815
Acquisition expense
Management and other expenses 291 234 260 304 861 304 886 961 1 069 451 1 138 439 101 046 183 621
Total expenses
Net profit/(loss) before tax 118 217 102 655 75 638 65 959 600 381 305 954 126 377 157 561
Tax
Net profit/(loss) after tax 1 831 297 1 660 195 1 493 649 1 796 868 3 941 180 3 538 279 629 302 758 997
Other comprehensive income/(loss)
Total comprehensive income/(loss) for the year 197 471 110 938 142 921 10 791 297 130 380 148 111 298 27 257
Transfer to/(from) retained earnings
Dividends 63 399 32 318 33 816 (302) 48 759 79 330 15 772 6 478
Change in retained earnings
Net premiums to gross premiums 134 072 78 620 109 105 11 093 248 371 300 818 95 526 20 779
Policyholder benefits and entitlements to earned premium
Management and other expenses to earned premium (56 607) 2 043 (13 281) 4 986 149 430 114 487 (50 519) 12 483
Comments
77 465 80 663 95 824 16 079 397 801 415 305 45 007 33 262
-- -- 5 939 (3 942) 50 519 (12 483)
100 000 - 106 415 - -- --
34 072 78 620 2 690 11 093 254 310 296 876 95 526 20 779
75% 75% 25% 54% 51% 51% 32% 32%
78% 81% 62% 70% 75% 72% 75% 89%
6% 6% 8% 5% 20% 11% 24% 34%
Company Company Composite company Company