
Page 149 - MC14326 all pages
P. 149
The South African Insurance Industry Survey 2016 | 145
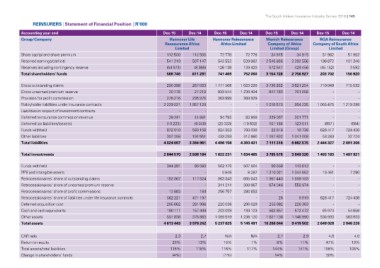
REINSURERS | Statement of Financial Position | R’000 Dec-15 Dec-14 Dec-15 Dec-14 Dec-15 Dec-14 Dec-15 Dec-14
Accounting year end Hannover Life Hannover Reinsurance Munich Reinsurance RGA Reinsurance
Group/Company Reassurance Africa Africa Limited Company of Africa Company of South Africa
Share capital and share premium Limited Limited (Group) Limited
Retained earnings/(deficit)
Reserves including contingency reserve 112 500 112 500 72 778 72 778 34 915 34 915 51 982 51 982
Total shareholders' funds 542 552 539 862
541 219 507 147 126 139 139 420 2 546 866 2 292 556 196 872 101 346
Gross outstanding claims 741 469 752 060
Gross unearned premium reserve (64 973) (8 366) 572 947 429 456 (45 152) 3 592
Provision for profit commission
Policyholder liabilities under insurance contracts 588 746 611 281 3 154 728 2 756 927 203 702 156 920
Liabilities in respect of investment contracts
Deferred reinsurance commission revenue 290 398 267 093 1 771 508 1 623 220 3 736 262 3 621 254 710 049 715 532
Deferred tax liabilities/(assets) 20 776 27 219 933 544 1 230 404 847 783 701 058 - -
Funds withheld 363 999 - - - -
Other liabilities 276 216 295 976 - 360 829 954 235
Total liabilities 2 229 021 1 957 129 - - 1 016 570 - 1 055 475 1 219 298
94 792 - - 201 771 - -
Total investments - - (25 333) 123 511 - -
39 241 44 881 924 353 83 900 229 067 19 738
Funds withheld (10 223) (8 046) 433 293 (10 832) 101 184 (897 ) (684)
PPE and intangible assets 872 010 589 158 793 030 1 041 008 626 417 724 436
Retrocessionaires' share of outstanding claims 307 258 191 551 4 496 156 312 880 22 618 6 662 575
Retrocessionaires' share of unearned premium reserve 4 024 697 3 364 961 4 393 431 1 157 832 53 283 32 724
Retrocessionaires' share of profit commissions 7 111 316 2 444 327 2 691 306
Retrocessionaires' share of liabilities under life insurance contracts
Deferred acquisition cost 2 644 570 2 506 184 1 622 231 1 634 465 3 785 576 3 849 326 1 403 183 1 497 921
Cash and cash equivalents
Other assets 344 291 85 580 562 179 507 504 99 558 113 613 - -
Total assets - - 9 848 8 287 1 310 021 1 044 662 13 461 7 280
1 957 440 1 899 183
CAR ratio 102 067 117 824 963 343 695 043 - -
Return on equity - - 311 211 300 067 674 346 556 974 - -
Total assets/total liabilities 256 757 280 853 - - - -
Change in shareholders' funds 12 683 164 626 417 724 436
562 221 471 197 - - 26 9 919 - -
205 662 261 986 220 038 290 029 255 082 226 363 65 974 54 656
190 111 157 444 203 099 193 123 562 857 572 472 538 993 563 933
551 838 375 863 1 088 919 1 236 120 1 621 138 1 146 990 2 648 028 2 848 226
4 613 443 3 976 242 5 237 625 5 145 491 10 266 044 9 419 502
2,3 2,7 N/A N/A 2,7 2,9 4,6 4,0
23% 13% 15% 1% 8% 11% 47% 13%
115% 118% 116% 117% 144% 141% 108% 106%
(4%) (1%) 14% 30%