Page 39 - MC14326 all pages
P. 39

The South African Insurance Industry Survey 2016 | 35

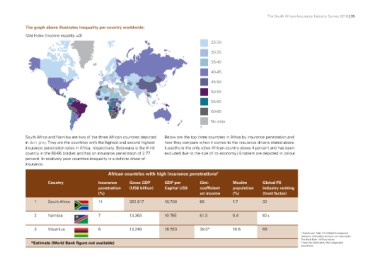
The graph above illustrates inequality per country worldwide:
Gini Index (Income equality =0)

                                                                                                25-30

                                                                                                30-35

                                                                                                35-40

                                                                                                40-45

                                                                                                45-50

                                                                                                50-55

                                                                                                55-60

                                                                                                60-66

                                                                                                No data

                                                                                         5

South Africa and Namibia are two of the three African countries depicted    Below are the top three countries in Africa by insurance penetration and
in dark grey. They are the countries with the highest and second highest    how they compare when it comes to the insurance drivers stated above.
insurance penetration rates in Africa, respectively. Botswana is the third  (Lesotho is the only other African country above 4 percent and has been
country in the 60-66 bracket and has an insurance penetration of 2.77       excluded due to the size of its economy.) Enablers are depicted in colour.
percent. In relatively poor countries inequality is a definite driver of
insurance.

                       African countries with high insurance penetrations6

          Country  Insurance                 Gross GDP                      GDP per      Gini-           Muslim      Global FS
1 South Africa     penetration               (US$ billion)                  Capital US$  coefficient     population  industry ranking
                   (%)                                                                   on income       (%)         (trust factor)

                   14                        352.817                        10,700       65              1.7         32

2 Namibia          7                         13,353                         10 765       61.3            0.4 82+

3 Mauritius        6                         13,240                         18 553       39.0*           16.6 68

*Estimate (World Bank figure not available)                                                                                                             5 Data Source: Table 2.9 of World Development
                                                                                                                                                        Indicators: Distribution of income or consumption
                                                                                                                                                        The World Bank – M Tracy Hunter
                                                                                                                                                        6 Swiss Re, World bank, NKC independent
                                                                                                                                                        economists
   34   35   36   37   38   39   40   41   42   43   44