Page 38 - MC14326 all pages
P. 38

34 | The South African Insurance Industry Survey 2016

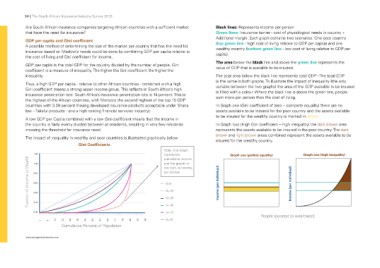
Are South African insurance companies targeting African countries with a sufficient market    Black lines: Represents income per person
that have the need for insurance?                                                             Green lines: Insurance barrier - cost of physiological needs in country +
                                                                                              Additional margin. Each graph contains two scenarios. One poor country
GDP per capita and Gini coefficient                                                           (top green line - high cost of living relative to GDP per capita) and one
A possible method of determining the size of the market per country that has the need for     wealthy country (bottom green line - low cost of living relative to GDP per
insurance based on Maslow’s needs could be done by combining GDP per capita relative to       capita).
the cost of living and Gini coefficient for income.
                                                                                              The area below the black line and above the green line represents the
GDP per capita is the total GDP for the country divided by the number of people. Gini         value of GDP that is available to be insured.
coefficient is a measure of inequality. The higher the Gini coefficient the higher the
inequality.                                                                                   The total area below the black line represents total GDP - The total GDP
                                                                                              is the same in both graphs. To illustrate the impact of inequality (the only
Thus, a high GDP per capita - relative to other African countries - combined with a high      variable between the two graphs) the area of the GDP available to be insured
Gini coefficient means a strong upper income group. This reflects in South Africa’s high      is filled with a colour. Where the black line is above the green line, people
insurance penetration rate. South Africa’s insurance penetration rate is 14 percent. This is  earn more per person than the cost of living.
the highest of the African countries, with Morocco the second highest of the top 10 GDP
countries with 3.09 percent (having developed insurance products acceptable under Sharia      In Graph one (Gini coefficient of zero – complete equality) there are no
law – Takaful products - and a high ranking financial services industry).                     assets available to be insured for the poor country and the assets available
                                                                                              to be insured for the wealthy country is marked in yellow.
A low GDP per Capita combined with a low Gini coefficient means that the income in
the country is fairly evenly divided between all residents, resulting in very few residents   In Graph two (High Gini coefficient – high inequality) the dark brown area
crossing the threshold for insurance need.                                                    represents the assets available to be insured in the poor country. The dark
                                                                                              brown and light brown areas combined represent the assets available to be
The impact of inequality in wealthy and poor countries is illustrated graphically below.      insured for the wealthy country.

                                 Gini Coefficients     Note: this Graph                       Graph one (perfect equality)                                                                                                                                                        Graph two (high inequality)
                                                       represents
1.20                                                   cumulative income
1.00                                                   and the graphs to
0.80                                                   the right, is income
                                                       per person
Fraction of Income or Wealth

                     1
                               8
                                          15
                                                     22
                                                                29
                                                                           36
                                                                                      43
                                                                                                 50
                                                                                                            57
                                                                                                                       64
                                                                                                                                  71
                                                                                                                                             78
                                                                                                                                                       85
                                                                                                                                                                  92
                                                                                                                                                                             99

                                                                                                                                                                                     Income (per individual)
                                                                                                                                                                                                                                                         Income (per individual)
0.60                                                   G=0                                    People (poorest to wealthiest)
0.40                                                   G=.25
0.20                                                   G=.33
0.00                                                   G=.45
                                                       G=.72
                     Cumulative Percent of Population  G=.81

www.youngamericansvoice.com
   33   34   35   36   37   38   39   40   41   42   43