
Page 36 - MC14326 all pages
P. 36
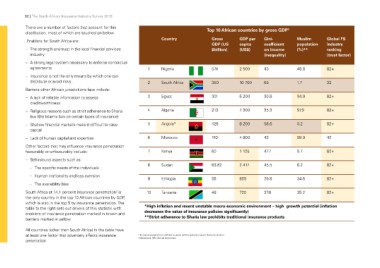
32 | The South African Insurance Industry Survey 2016                       Top 10 African countries by gross GDP3

There are a number of factors that account for this         Country         Gross                                                                 GDP per  Gini-         Muslim      Global FS
distribution, most of which are touched on below.                           GDP (US                                                               capita   coefficient   population  industry
                                                                            $billion)                                                             (US$)    on income     (%)**       ranking
 Enablers for South Africa are:                                                                                                                            (inequality)              (trust factor)

–– The strength and trust in the local financial services   1 Nigeria       574                                                                   2 500    43            48.8 82+
   industry
                                                            2 South Africa  350                                                                   10 700   65            1.7 32
–– A strong legal system necessary to enforce contractual
   agreements                                               3 Egypt         301                                                                   6 200    30.8          94.9 82+

–– Insurance is not the only means by which one can         4 Algeria       213                                                                   7 300    35.3          97.9 82+
   distribute or avoid risks.
                                                            5 Angola*       126                                                                   8 200    58.6          0.2 82+
Barriers other African jurisdictions face include:
                                                            6 Morocco       110                                                                   4 800    43            99.9 42
–– A lack of reliable information to assess
   creditworthiness                                         7 Kenya         60                                                                    1 125    47.7          9.7 82+

–– Religious reasons such as strict adherence to Sharia     8 Sudan         63.82                                                                 2 417    45.5          6.2 82+
   law (the Islamic ban on certain types of insurance)
                                                            9 Ethiopia      55 859 29.8                                                                                  34.6 82+
–– Shallow financial markets make it difficult to raise
   capital                                                  10 Tanzania     48 720 37.6                                                                                  35.2 82+

–– Lack of human capital and expertise                      *High inflation and recent unstable macro-economic environment – high growth potential (inflation
                                                            decreases the value of insurance policies significantly)
Other factors that may influence insurance penetration      **Strict adherence to Sharia law prohibits traditional insurance products
favourably or unfavourably include:
                                                            2 Insurance penetration is defined as gross written premium / gross domestic product
–– Behavioural aspects such as:                             3 World bank, NKC African economics

   –– The specific needs of the individuals

   –– Human irrationality and loss aversion

   –– The availability bias

South Africa at 14.1 percent insurance penetration2 is
the only country in the top 10 African countries by GDP,
which is also in the top 5 by insurance penetration. The
table to the right sets out drivers of this statistic with
enablers of insurance penetration marked in brown and
barriers marked in yellow.

All countries (other than South Africa) in the table have
at least one factor that adversely affects insurance
penetration.