
Page 99 - MC14326 all pages
P. 99
The South African Insurance Industry Survey 2016 | 95
A review of the business activity in the insurance industry over the last The Rand depreciated against the Dollar by 34% for the year, closing at
twelve to fifteen months gives us a clear indication that insurers are R15.515:USD1. A most notable factor was Nenegate – the biggest financial
trying to overcome tough times by embracing the principles of business crisis South Africa has experienced since the advent of democracy resulting in
unusual . . . or disruptive innovation. Traditional insurers want to enjoy half a trillion Rand being wiped off the value of South African stocks and bonds.
the growth rates that “more innovative” and niche players have attained
and who have significantly contributed to the increase in gross written Adding fuel to the fire, South Africa is facing the worst drought in the last
premium for the year of 11%.1 No longer are traditional expansion plans 111 years. Water shortages are of significant concern and the drought is
adequate. Thinking outside the box is key to make fundamental strides far-reaching, affecting most of the South African regions. This is increasing
in an industry where market share is hard to come by. harvesting losses and also creating conditions for increased fire losses.
The participants (referred to as “the industry”) reported gross written . . . and with the average South African consumer becoming poorer due to the
premiums of R89.1 billion in 2015 an increase of 11.4% when compared economic environment and rising unemployment, insurance products still
to the R80.0 billion written in 2014. Growth in the industry is being hindered remain a luxury product. Approximately 60% of motors on South African roads
by unfavourable macro-economic factors, weather related disruptions and are uninsured due to the unaffordability of insurance. The unemployment rate
shrinking disposable household income due to increasing unemployment in South Africa increased to 26.7% in the three months to March of 2016 from
rates. 24.5% in the previous quarter and above market expectations of 25.3%. It was
the highest reading since September 2005.
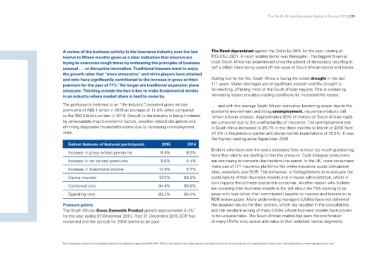
Salient features of featured participants 2015 2014
Increase in gross written premiums 11.4% 8.0% Brokers who have over the years increased fees without too much questioning
Increase in net earned premiums 8.8% 5.4% from their clients are starting to feel the pressure. Cash-strapped consumers
Increase in investment income 12.4% 5.7% are continuing to compare their bottom-line spend. In the UK, more consumers
Claims incurred 57.2% 63.5% make use of DIY insurance platforms like online insurance quote comparison
Combined ratio 94.4% 98.6% sites, especially post RDR. This behaviour, is forcing brokers to re-evaluate the
Operating ratio 83.2% 88.4% sustainability of their business models and in-house administration, which in
turn impacts the ultimate cost to the consumer. Another reason why brokers
Pressure points are revisiting their business models is the talk about the FSB wanting to do
The South African Gross Domestic Product growth approximated 0.4%2 away with fees (other than commission) payable to insurers and brokers in its
for the year ended 31 December 2015. Post 31 December 2015 GDP has RDR review paper. Many underwriting managers (UMAs) have not delivered
worsened and the outlook for 2016 seems to be poor. the required returns for their carriers, which has resulted in the consolidation
and the resultant exiting of many UMAs whose business models have proven
to be unsustainable. The South African market has seen the proliferation
of many UMAs who cannot add value in their selected market segments.
1The net premiums written of the companies featured in this publication approximate 90% (2014 : 85%) of the industry’s net written premiums and based on that, the survey results are a fair representation of the results of the overall industry. 2www.tradingeconomics.com