Page 104 - MC14326 all pages
P. 104

100 | The South African Insurance Industry Survey 2016

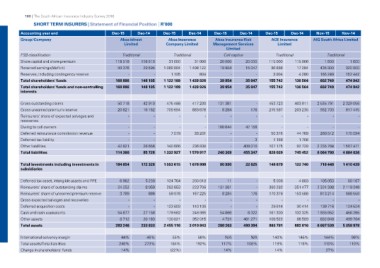
     SHORT TERM INSURERS | Statement of Financial Position | R’000

Accounting year end                            Dec-15      Dec-14       Dec-15         Dec-14         Dec-15      Dec-14        Dec-15      Dec-14       Nov-15         Nov-14
Group/Company
                                               Absa idirect              Absa Insurance                Absa Insurance Risk      ACE Insurance            AIG South Africa Limited
                                                  Limited               Company Limited               Management Services           Limited

                                                                                                                Limited

FSB classification                             Traditional              Traditional                   Cell captive              Traditional              Traditional
Share capital and share premium
Retained earnings/(deficit)                    118 510      118 510     31 000         31 000         20 000        20 000      115 000      115 000     1 600          1 600
Reserves, including contingency reserve
Total shareholders' funds                      50 376        29 595     1 089 994 1 408 122           19 954        15 047      36 838       17 284      435 900        320 900
Total shareholders' funds and non-controlling
interests                                              --               1 195            804                  --                3 904          4 280     165 249        152 442

                                               168 886      148 105     1 122 189 1 439 926           39 954        35 047      155 742      136 564     602 749        474 942

                                               168 886      148 105     1 122 189 1 439 926           39 954        35 047      155 742      136 564     602 749        474 942

Gross outstanding claims                        50 718       42 910       475 488        417 200      131 381                -  453 723      403 011     2 535 791      2 329 056
Gross unearned premium reserve                  20 821       16 162       709 694        883 678         8 284           176    215 597      203 235       932 703        817 415
Reinsurers' share of expected salvages and                                                                     -                                                     -              -
recoveries                                              -            -              -              -                         -           -            -
Owing to cell owners                                                                                  100 644                                                        -              -
Deferred reinsurance commission revenue                 -            -              -              -           -     47 158              -            -    260 512        170 094
Deferred tax liability                                  -            -       7 079         33 201              -             -   50 376       44 769
Other liabilities                                       -            -                                         -             3                                       -              -
Total liabilities                               42 821       26 656                 -              -                               1 168        1 708    2 335 784      1 567 471
                                               114 360       85 728       140 666        236 838      240 309       408 010     107 175       92 729     6 064 790      4 884 036
                                                                        1 332 927      1 570 917                    455 347     828 039      745 452

Total investments including investments in     184 654      172 328 1 553 615 1 678 808               80 990        22 625      148 679      122 740     716 448 1 410 439
subsidiaries

Deferred tax asset, intangible assets and PPE     6 962        5 239      124 764        200 018             11              -     5 006        4 883      105 053          80 167
Reinsurers' share of outstanding claims         24 252         8 059      283 653        223 706      131 381                -  360 282      351 477     2 324 308      2 119 249
Reinsurers' share of unearned premium reserve                                            167 225                         176    170 378      153 588
Gross expected salvages and recoveries            3 789          886        59 078                       8 284               -                             813 214        668 550
Deferred acquisition costs                              -            -              -              -           -             -           -            -              -              -
Cash and cash equivalents                               -            -                   140 106               -       6 322     29 614       30 414
Other assets                                                              123 603        248 965                    461 271     161 300      132 325       139 716        124 524
Total assets                                    54 877       27 158       179 582        352 015       54 866       490 394     108 522       86 589     1 935 952        456 265
                                                  8 712      20 163       130 821      3 010 843         4 731                  983 781      882 016                      499 784
                                                            233 833     2 455 116                                                                          632 848      5 358 978
                                               283 246                                                280 263                                            6 667 539

International solvency margin                   44%           46%        55%            56%              N/A           N/A      140%           145%      144%            96%
Total assets/Total liabilities                 248%          273%       184%           192%           117%          108%        119%           118%      110%           110%
Change in shareholders' funds                                           (22%)
                                                14%                                                    14%                       14%                      27%
   99   100   101   102   103   104   105   106   107   108   109