Page 128 - MC14326 all pages
P. 128

124 | The South African Insurance Industry Survey 2016

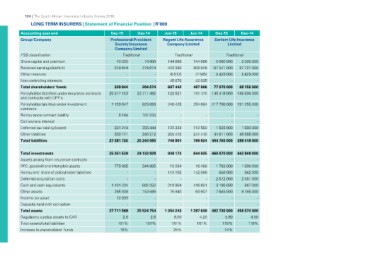
    LONG TERM INSURERS | Statement of Financial Position | R’000

Accounting year end                                 Dec-15          Dec-14          Jun-15         Jun-14         Dec-15            Dec-14
Group/Company
                                                    Professional Provident          Regent Life Assurance         Sanlam Life Insurance
FSB classification                                     Society Insurance               Company Limited                      Limited
Share capital and premium                              Company Limited
Retained earnings/(deficit)
Other reserves                                      Traditional                     Traditional                              Traditional
Non-controlling interests                                                                                            5 000 000 5 000 000
Total shareholders' funds                           10 000          10 000          144 688        144 688         67 541 000 57 727 000
Policyholder liabilities under insurance contracts                                                                   5 429 000 5 429 000
and contracts with DPF's                            319 844         274 674         423 390        308 648
Policyholder labilities under investment                                                                                         --
contracts                                                   --                      (6 512)        (7 565)         77 970 000 68 156 000
Reinsurance contract liability                                                                                    140 418 000 148 804 000
Cell owners interest                                        --                      45 876         42 035
Deferred tax liability/(asset)
Other liabilities                                   329 844         284 674         607 442        487 806
Total liabilities
                                                    25 577 153 23 711 492           122 627        191 170

                                                    1 139 647       825 699         246 425        254 684 217 796 000 191 255 000

                                                           6 184        107 233              -              -                    -                 -
                                                                 -               -           -              -                    -                 -
                                                                                    122 334        112 560           1 635 000         1 693 000
                                                        331 214         355 444     255 415        241 410         44 911 000        46 666 000
                                                        333 711         240 212     746 801        799 824        404 760 000       388 418 000
                                                    27 381 725      25 240 080

Total investments                                   25 251 529      24 133 928        938 173        644 835      466 870 000       442 849 000
Assets arising from insurance contracts                          -               -              -              -                 -                 -
PPE; goodwill and intangible assets
Reinsurers' share of policyholder liabilities           779 965         544 885         10 084         18 498        1 703 000         1 690 000
Deferred acquisition costs                                       -               -    110 192        142 089           650 000           642 000
Cash and cash equivalents                                        -               -
Other assets                                                                                    -              -     2 672 000         2 561 000
Income tax asset                                     1 401 234          692 352       219 954        418 601         3 190 000           647 000
Deposits held with cell option                          265 908         153 589                                      7 645 000
Total assets                                             12 933                         75 840         63 607                          8 185 000
Regulatory surplus assets to CAR                                 -               -              -              -                 -                 -
Total assets/total liabilities                                                   -              -              -                 -                 -
Increase in shareholders' funds                     27 711 569      25 524 754                                    482 730 000
                                                              2,6             2,6   1 354 243      1 287 630                5,80    456 574 000
                                                                          101%             8,00           4,20            119%                4,50
                                                          101%                                                              14%
                                                            16%                          181%           161%                                118%
                                                                                          25%
   123   124   125   126   127   128   129   130   131   132   133