Page 131 - MC14326 all pages
P. 131

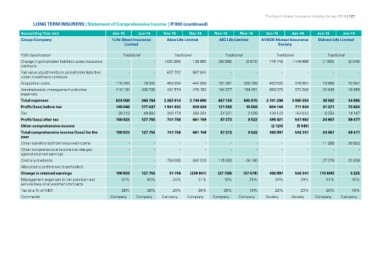
The South African Insurance Industry Survey 2016 | 127

LONG TERM INSURERS | Statement of Comprehensive Income | R’000 (continued)

Accounting Year end                                 Jun-15       Jun-14       Dec-15         Dec-14         Nov-15       Nov-14       Jun-15      Jun-14      Jun-15       Jun-14
Group/Company
                                                    1Life Direct Insurance    Absa Life Limited             AIG Life Limited          AVBOB Mutual Assurance  Bidvest Life Limited
                                                             Limited                                                                               Society

FSB classification                                  Traditional               Traditional                   Traditional                    Traditional        Traditional
Change in policyholder liabilities under insurance      -                                                                             776 742 1 448 868
contracts                                                                   - (125 389)      138 960        (38 388)     (2 873)                              (1 095)      (2 346)
Fair value adjustments on policyholder liabilities
under investment contracts                                  - - 637 700 987 944 - -                                                           ----
Acquisition costs
Administration, management and other                119 743       78 002      459 354        441 958        191 591      289 789      450 592     376 907     10 880       10 847
expenses                                            416 130      305 795      491 574        478 152        104 577      154 251      669 070     572 506     22 649       18 656
Total expenses
Profit/(loss) before tax                            624 008      340 764      2 263 914      2 749 680      487 150      645 975      2 701 296   3 065 093   38 582       34 895
Tax                                                 140 046      177 437      1 041 932        929 420      121 593       10 558        634 144     711 934   31 221       73 624
Profit/(loss) after tax                                                                        268 261                      2 036       139 123     164 042                14 147
Other comprehensive income                           39 213       49 682        300 174        661 159       34 321         8 522       495 021     547 892    6 254       59 477
Total comprehensive income/(loss) for the           100 833      127 755        741 758                  -   87 272               -      (2 124)     (5 545)  24 967
year                                                                                           661 159                      8 522       492 897     542 347                        -
Other transfers to/(from) retained income                    -            -               -                          -                                                -    59 477
Other comprehensive income not charged              100 833      127 755        741 758                      87 272                                           24 967
against retained earnings
Ordinary dividends                                          ------                                                                            - - 11 288 30 852
Allocated to preference shareholders                        ------                                                                            ----
Change in retained earnings
Management expenses to net premium and                       -            -   704 000          892 000      115 000        46 100              -           -    27 279     23 400
service fees on investment contracts                         -            -            -                -             -            -           -           -            -          -
Tax as a % of NIBT                                  100 833      127 755                                                              492 897     542 347
Comments                                                57%          80%       37 758        (230 841)      (27 728)     (37 578)         29%         29%     (13 600)      5 225
                                                                                  20%              21%          18%          25%                                  51%        45%

                                                            28%          28%          29%            29%            28%          19%         22%         23%          20%          19%
                                                    Company      Company      Company        Company        Company      Company      Society     Society     Company      Company
   126   127   128   129   130   131   132   133   134   135   136