
Page 125 - MC14326 all pages
P. 125
The South African Insurance Industry Survey 2016 | 121
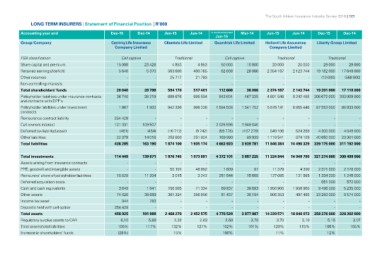
LONG TERM INSURERS | Statement of Financial Position | R’000
Accounting year end Dec-15 Dec-14 Jun-15 Jun-14 15 month period ended Mar-14 Jun-15 Jun-14 Dec-15 Dec-14
Jun-15
Group/Company Centriq Life Insurance Clientele Life Limited Guardrisk Life Limited Hollard Life Assurance Liberty Group Limited
Company Limited Company Limited
FSB classification Cell captive Traditional Cell captive Traditional Traditional
Share capital and premium 15 000
Retained earnings/(deficit) 23 428 4 853 4 853 50 000 10 000 20 000 20 000 29 000 29 000
Other reserves 5 640 5 370
Non-controlling interests - - 563 600 490 765 62 608 28 086 2 354 187 2 123 744 19 182 000 17 649 000
Total shareholders' funds - -
Policyholder liabilities under insurance contracts 25 717 21 783 -- -- (10 000) (568 000)
and contracts with DPF's 20 640 28 798
Policyholder labilities under investment 36 740 38 219 -- -- -- --
contracts
Reinsurance contract liability 594 170 517 401 112 608 38 086 2 374 187 2 143 744 19 201 000 17 110 000
Cell owners interest
Deferred tax liability/(asset) 689 676 695 554 943 604 467 335 4 601 546 6 242 485 206 672 000 203 009 000
Other liabilities
Total liabilities 1 867 1 900 942 336 998 338 1 584 508 1 541 752 5 576 191 6 855 446 87 553 000 80 833 000
254 429 - - - - - - - - -
121 331 109 507 - - 2 025 596 1 948 040 - - - -
(16 712) (9 742) (107 279) 549 106 524 269 4 300 000 4 049 000
(461) (454) 258 800 251 024 (59 778) 1 119 541 874 129 40 650 000 23 301 000
22 379 14 018 1 874 100 1 935 174 169 990 89 933 11 846 384 14 496 329 339 175 000 311 192 000
436 285 163 190 4 663 920 3 939 781
Total investments 114 449 139 671 1 876 745 1 973 891 4 372 101 3 887 225 11 224 844 14 049 790 321 274 000 309 498 000
Assets arising from insurance contracts - - - - - - - - - -
PPE; goodwill and intangible assets - -
Reinsurers' share of policyholder liabilities 50 191 48 052 1 609 97 11 379 4 300 2 371 000 2 178 000
Deferred acquisition costs 10 028 11 204 3 015 3 242 251 544 15 668 127 095 131 585 1 334 000 1 245 000
Cash and cash equivalents - - - -
Other assets - - - - 651 000 572 000
Income tax asset 3 649 1 641 156 995 71 334 69 837 38 683 1 950 900 1 956 905 9 496 000 5 235 000
Deposits held with cell option 74 026 38 689 381 324 356 056 81 437 36 194 23 250 000 9 574 000
Total assets 906 353 497 493
Regulatory surplus assets to CAR 344 783 - - - - - - - -
Total assets/total liabilities 254 429 - - - - - - - - -
Increase in shareholders’ funds 456 925 2 468 270 2 452 575 4 776 528 3 977 867 358 376 000 328 302 000
191 988 2,32 2,03 2,60 3,70 14 220 571 16 640 073 5,15 3,07
6,10 5,80 132% 127% 102% 101% 3,70 3,10 106% 105%
105% 15% 196% 12%
(28%) 117% 120% 115%
11%