
Page 122 - MC14326 all pages
P. 122
118 | The South African Insurance Industry Survey 2016
assumption changes. Despite the investment volatility experienced late in the Simultaneously, discretionary margins held largely to fund these overheads
year, on an aggregate basis, participants in the survey were able to report a 5% were also adjusted with the net profit impact for Liberty being immaterial.
increase in total assets year-on-year. The table below shows the total assets Also, MMI Holdings during the release of its results for the six months
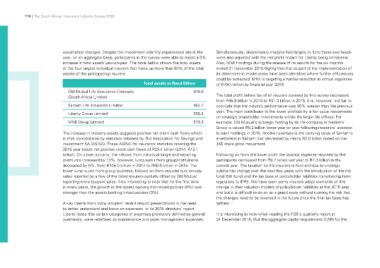
of the four largest individual insurers that make up more than 80% of the total ended 31 December 2015 highlighted that as part of the implementation of
assets of the participating insurers. its client-centric model areas have been identified where further efficiencies
could be extracted. MMI is targeting a further reduction in annual expenses
Old Mutual Life Assurance Company Total assets in Rand Billion of R750 million by financial year 2019.
(South Africa) Limited 619.8
The total profit before tax of all insurers covered by this survey decreased
Sanlam Life Insurance Limited 482.7 from R45.8 billion in 2014 to R31.3 billion in 2015. It is, however, not fair to
358.4 conclude that the industry performance was 30% weaker than the previous
Liberty Group Limited 373.3 year. The main contributor to the lower profitability is fair value movements
on strategic shareholder investments within the larger life offices. For
MMI Group Limited example, Old Mutual’s strategic holding by its life company in Nedbank
Group is valued R5.2 billion lower year on year following investors’ aversion
The increase in industry assets suggests positive net client cash flows which to bank holdings in 2015. Another example is the carrying value of Sanlam’s
is then corroborated by statistics released by The Association for Savings and investment in Santam that decreased by nearly R2.0 billion based on the
Investment SA (ASISA). These ASISA life insurance statistics covering the JSE share price movement.
2015 year report net positive client cash flows of R23.4 billion (2014: R12.1
billion). On closer scrutiny, the inflows from individual single and recurring Following on from the lower profit the taxation expense reported by the
premiums increased by 13%, however, lump sums from group/institutional participants decreased from R9.7 billion last year to R7.3 billion in the
decreased by 5%, from R105.0 billion in 2014 to R99.6 billion in 2015. The current year. The taxation for life insurers is fluid and due to undergo
lower lump sums from group business, follows on from reduced bulk annuity substantial change over the next few years with the introduction of the risk
sales reported by a few of the listed insurers partially offset by Old Mutual fund (5th fund) and the tax base of policyholder liabilities transitioning from
reporting more buoyant sales. Also interesting to note that for the first time regulatory to IFRS. We have seen some insurers adopt elements of this
in many years, the growth in the assets backing non-linked policies (9%) was change in their valuation models of policyholder liabilities at the 2015 year
stronger than the assets backing linked policies (3%). end but it is difficult to do so on a grand scale without running the risk that
the changes need to be reversed in the future once the final tax basis has
A key theme from many insurers’ recent results presentations is the need settled.
to better understand and focus on expenses. In its 2015 directors’ report
Liberty notes that certain categories of expenses previously defined as general It is interesting to note when reading the FSB’s quarterly report at
overheads, were redefined as maintenance and asset management expenses. 31 December 2015, that the aggregate capital requirement (CAR) for the