
Page 126 - MC14326 all pages
P. 126
122 | The South African Insurance Industry Survey 2016
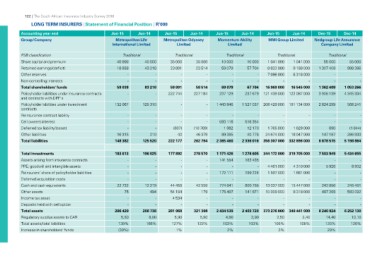
LONG TERM INSURERS | Statement of Financial Position | R’000
Accounting year end Jun-15 Jun-14 Jun-15 Jun-14 Jun-15 Jun-14 Jun-15 Jun-14 Dec-15 Dec-14
Group/Company
Metropolitan Life Metropolitan Odyssey Momentum Ability MMI Group Limited Nedgroup Life Assurance
International Limited Limited Limited Company Limited
FSB classification Traditional Traditional Traditional Traditional Traditional
Share capital and premium 40 000 1 041 000 1 041 000
Retained earnings/(deficit) 18 038 40 000 35 000 35 000 10 000 10 000 8 832 000 9 188 000 55 000 55 000
Other reserves 43 218 7 096 000 6 316 000
Non-controlling interests - 23 891 23 514 59 079 57 704 1 307 409 998 266
Total shareholders' funds - - --
Policyholder liabilities under insurance contracts 58 038 - -- -- 16 969 000 16 545 000 --
and contracts with DPF's - 83 218 121 439 000 122 087 000
Policyholder labilities under investment - -- -- --
contracts
Reinsurance contract liability 58 891 58 514 69 079 67 704 1 362 409 1 053 266
Cell owners interest
Deferred tax liability/(asset) 222 744 227 184 237 129 237 679 3 906 139 4 345 334
Other liabilities
Total liabilities 132 067 125 310 -- 1 443 846 1 527 037 208 429 000 191 134 000 2 824 299 568 241
- - - - - - - - - -
- - - - 593 118 518 354 - - - -
- - (607) (10 769) 1 765 000 1 628 000 890 (1 644)
16 315 210 40 46 379 1 982 12 170 24 674 000 18 047 000 147 187 286 933
148 382 125 520 222 177 262 794 89 385 40 776 356 307 000 332 896 000 6 878 515 5 198 864
2 365 460 2 336 016
Total investments 183 613 196 025 177 892 278 570 1 171 426 1 278 605 344 172 000 319 705 000 7 503 949 5 434 655
Assets arising from insurance contracts - - - - 141 554 183 465 - - - -
PPE; goodwill and intangible assets - - - - - -
Reinsurers' share of policyholder liabilities - - - - 172 111 199 224 4 461 000 4 310 000 5 920 8 902
Deferred acquisition costs - - - - - - 1 597 000 1 661 000 - -
Cash and cash equivalents 774 041 600 755 - -
Other assets 22 732 12 219 44 458 42 559 175 407 141 671 - -
Income tax asset 75 494 54 184 179 - - 13 037 000 15 447 000 243 850 248 481
Deposits held with cell option - - - - - 10 009 000 487 205 560 092
Total assets - - 4 534 - 8 318 000
Regulatory surplus assets to CAR - 2 434 539 2 403 720 - - - -
Total assets/total liabilities 206 420 208 738 321 308 4,90 3,90 - - - -
Increase in shareholders' funds 5,60 8,00 281 068 5,90 373 276 000 8 240 924 6 252 130
5,90 103% 103% 2,50 349 441 000 14,40 10,10
139% 166% 122% 2% 105% 2,40 120% 120%
(30%) 127% 3% 29%
1% 105%