
Page 124 - MC14326 all pages
P. 124
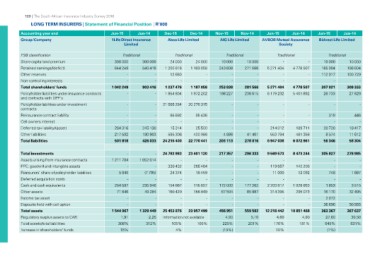
120 | The South African Insurance Industry Survey 2016
LONG TERM INSURERS | Statement of Financial Position | R’000
Accounting year end Jun-15 Jun-14 Dec-15 Dec-14 Nov-15 Nov-14 Jun-15 Jun-14 Jun-15 Jun-14
Group/Company
1Life Direct Insurance Absa Life Limited AIG Life Limited AVBOB Mutual Assurance Bidvest Life Limited
Limited Society
FSB classification Traditional Traditional Traditional Traditional Traditional
Share capital and premium --
Retained earnings/(deficit) 398 000 360 000 24 000 24 000 10 000 10 000 10 000 10 000
Other reserves 5 271 404 4 778 507
Non-controlling interests 644 249 543 416 1 200 816 1 163 058 243 838 271 566 -- 185 004 198 604
Total shareholders' funds --
Policyholder liabilities under insurance contracts -- 12 660 - -- 112 017 100 729
and contracts with DPF's 5 271 404 4 778 507
Policyholder labilities under investment -- -- -- 6 179 232 5 401 892 --
contracts
Reinsurance contract liability 1 042 249 903 416 1 237 476 1 187 058 253 838 281 566 307 021 309 333
Cell owners interest
Deferred tax liability/(asset) -- 1 854 804 1 972 202 198 227 236 615 26 733 27 829
Other liabilities
Total liabilities - - 21 665 284 20 276 315 ---- --
- - 85 692 95 436 - - - - 319 446
- - - - - - - - - -
284 316 245 130 - - 214 012 189 711
217 502 180 903 15 314 25 500 4 886 41 401 553 794 481 358 20 720 18 417
501 818 426 033 595 306 400 988 203 113 278 016 6 947 038 6 072 961 8 574 11 612
24 216 400 22 770 441 58 304
56 346
Total investments - - 24 783 983 23 401 120 217 357 296 333 9 569 573 8 473 244 305 827 278 985
Assets arising from insurance contracts 1 211 784 1 052 014 - - - - - -
PPE; goodwill and intangible assets -- - - - -
Reinsurers' share of policyholder liabilities - - - - 119 657 142 206
Deferred acquisition costs 5 840 (7 795) 330 432 265 464 - - 11 000 12 092 748 1 687
Cash and cash equivalents - - - -
Other assets - - 24 374 18 459 172 000 177 262
Income tax asset 254 597 235 946 67 594 85 987 2 203 817 1 928 853 1 853 3 515
Deposits held with cell option -- - - 314 395 295 073 16 170 32 495
Total assets 71 846 49 284 - - - -
Regulatory surplus assets to CAR - - 154 667 115 607 - - 2 072 -
Total assets/total liabilities - - 456 951 559 582 36 696 50 955
Increase in shareholders' funds 160 420 156 849 4,90 5,10 12 218 442 10 851 468 363 367 367 637
1 544 067 1 329 449 4,60 4,80
1,91 2,25 -- 225% 201% 27,60 30,50
(10%) 176% 181% 645% 631%
308% 312% -- 10%
15% (1%)
25 453 876 23 957 499
Information not available
105% 105%
4%