
Page 127 - MC14326 all pages
P. 127
The South African Insurance Industry Survey 2016 | 123
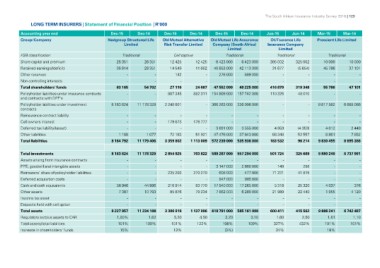
LONG TERM INSURERS | Statement of Financial Position | R’000
Accounting year end Dec-15 Dec-14 Dec-15 Dec-14 Dec-15 Dec-14 Jun-15 Jun-14 Mar-15 Mar-14
Group/Company
Nedgroup Structured Life Old Mutual Alternative Old Mutual Life Assurance OUTsurance Life Prescient Life Limited
FSB classification Limited Risk Transfer Limited Company (South Africa) Insurance Company
Share capital and premium Limited
Retained earnings/(deficit) Limited
Other reserves
Non-controlling interests Traditional Cell captive Traditional Traditional Traditional
Total shareholders' funds 26 351
Policyholder liabilities under insurance contracts 36 814 26 351 12 425 12 425 6 423 000 6 423 000 385 002 325 002 10 000 10 000
and contracts with DPF's 28 351
Policyholder labilities under investment - 14 549 11 662 40 853 000 42 113 000 31 877 (5 654) 45 786 37 101
contracts - -
Reinsurance contract liability 63 165 - 142 - 276 000 689 000 -- --
Cell owners interest - 54 702
Deferred tax liability/(asset) - ---- -- --
Other liabilities
Total liabilities 27 116 24 087 47 552 000 49 225 000 416 879 319 348 55 786 47 101
867 345 882 311 154 809 000 157 742 000 110 325 48 010 --
8 163 624 11 178 329 2 240 601 - 366 263 000 336 996 000 - - 9 817 582 6 685 086
- - - - - - - - - -
- - 179 673 178 777 - - - - - -
- - 3 691 000 3 555 000 4 859 (4 353) 4 012 2 448
1 168 1 077 - - 47 476 000 37 643 000 68 348 52 557 8 861 7 852
8 164 792 11 179 406 72 183 51 921 572 239 000 535 936 000 183 532 96 214 9 830 455 6 695 386
3 359 802 1 113 009
Total investments 8 163 624 11 178 329 2 854 925 703 822 589 287 000 557 294 000 501 724 325 689 9 880 249 6 737 991
Assets arising from insurance contracts - - - - - - - - - -
PPE; goodwill and intangible assets - - - - - -
Reinsurers' share of policyholder liabilities - - 3 147 000 2 860 000 149 298 - -
Deferred acquisition costs - - 235 203 270 270 608 000 477 000 71 231 41 815 - -
Cash and cash equivalents - - 947 000 985 000
Other assets 56 946 44 986 - - 4 037 376
Income tax asset 7 387 10 793 210 914 83 770 17 940 000 17 265 000 5 318 25 320 1 955 4 120
Deposits held with cell option - 85 876 79 234 7 862 000 6 280 000 21 989 22 440
Total assets - - - - - - -
Regulatory surplus assets to CAR - - - - - - - - -
Total assets/total liabilities 8 227 957 11 234 108 - - - 9 886 241 6 742 487
Increase in shareholders' funds 1,80% 1,62 3 386 918 1 137 096 619 791 000 585 161 000 600 411 415 562 1,61 1,10
101% 100% 5,20 4,50 3,20 3,10 1,60 2,50 101% 101%
15% 122% 327% 432% 18%
101% 108% 109% 31%
13% (3%)