
Page 116 - MC14326 all pages
P. 116
112 | The South African Insurance Industry Survey 2016
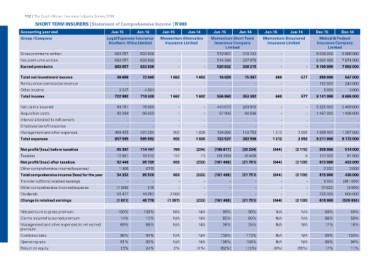
SHORT TERM INSURERS | Statement of Comprehensive Income | R’000
Accounting year end Jun-15 Jun-14 Jun-15 Jun-14 Jun-15 Jun-14 Jun-15 Jun-14 Dec-15 Dec-14
Group /Company
Legal Expenses Insurance Momentum Alternative Momentum Short Term Momentum Structured Mutual & Federal
Southern Africa Limited Insurance Limited Insurance Company Insurance Limited Insurance Company
Limited
Limited
Gross premiums written 683 057 633 938 - - 519 962 343 232 -- 9 038 000 8 886 000
Net premiums written --
Earned premiums 683 057 633 938 - - 516 288 337 978 -- 8 082 000 7 874 000
683 057 633 938 - - 520 832 338 215 8 100 000 7 893 000
Total net investment income 36 688 72 040 1 662 1 602 16 028 15 087 668 577 880 000 547 000
Reinsurance commission revenue
Other income - - - - - - - - 152 000 243 000
Total income
3 247 4 361 - - - - - - 9 000 3 000
722 992 710 339 1 662 1 602 536 860 353 302 668 577 9 141 000 8 686 000
Net claims incurred 94 781 78 669 - - 440 673 203 915 - - 5 325 000 5 469 000
Acquisition costs 93 389 96 629
Interest allocated to cell owners - - 97 966 60 838 - - 1 487 000 1 436 000
Employee benefit expense - -
Management and other expenses - - --------
Total expenses 469 425 420 294
657 595 595 592 --------
902 1 836 184 898 118 753 1 312 2 692 1 399 000 1 267 000
902 1 836 723 537 383 506 1 312 2 692 8 211 000 8 172 000
Net profit/(loss) before taxation 65 397 114 747 760 (234) (186 677) (30 204) (644) (2 115) 930 000 514 000
Taxation 12 951 19 012 157 (1) (25 269) (8 453) - 5 117 000 81 000
Net profit/(loss) after taxation 52 446 95 735 603 813 000
Other comprehensive income/(expense) (215) (233) (161 408) (21 751) (644) (2 120) 433 000
Total comprehensive income/(loss) for the year 1 906 95 520 - - - - - - 2 000 3 000
Transfer to/(from) retained earnings 54 352 - 603 815 000
Other comprehensive (income)/expense 215 (233) (161 408) (21 751) (644) (2 120) 436 000
Dividends - 49 957 - - - - - - 2 000 (361 000)
Change in retained earnings (1 906) 45 778 - - - - - - (2 000)
53 477 2 000 - - - - - 200 000 (3 000)
(1 031) (1 397) 615 000 600 000
(233) (161 408) (21 751) (644) (2 120) (528 000)
Net premium to gross premium 100% 100% N/A N/A 99% 98% N/A N/A 89% 89%
Claims incurred to earned premium 14% 12% N/A N/A 85% 60% N/A N/A 66% 69%
Management and other expenses to net earned 69% 66% N/A N/A 36% 35% N/A N/A 17% 16%
premium
Combined ratio 96% 94% N/A N/A 139% 113% N/A N/A 99% 100%
Operating ratio 91% 83%
Return on equity 13% 24% N/A N/A 136% 109% N/A N/A 89% 94%
2% (1%) (62%) (15%) (9%) (36%) 17% 11%