Page 117 - MC14326 all pages
P. 117

The South African Insurance Industry Survey 2016 | 113

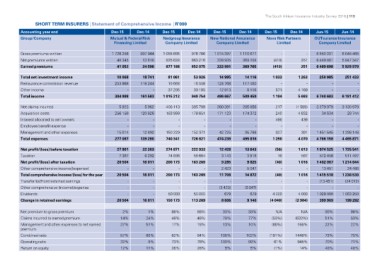
SHORT TERM INSURERS | Statement of Comprehensive Income | R’000

Accounting year end                             Dec-15      Dec-14      Dec-15         Dec-14      Dec-15      Dec-14      Dec-15     Dec-14     Jun-15         Jun-14
Group/Company
                                                Mutual & Federal Risk   Nedgroup Insurance         New National Assurance  Nova Risk Partners    OUTsurance Insurance
                                                  Financing Limited      Company Limited               Company Limited             Limited          Company Limited

Gross premiums written                          1 728 258   997 944     1 055 695      978 786     1 015 397   1 110 677         -                 - 6 580 001 6 048 468
Net premiums written                                40 345   13 618       925 628      863 216       338 935     369 108   (410)               251 6 489 861 5 947 347
Earned premiums                                     41 052   24 598       877 188      852 075       333 991     369 765   (410)               251 6 489 698 5 929 979

Total net investment income                      10 068      18 741         81 061      53 926      14 995      14 116     1 033       1 263       250 985        251 433
Reinsurance commission revenue                  253 868     118 244         19 668      10 558     124 768     117 460           -            -              -              -
Other income                                                                37 295      33 195                                                               -              -
Total income                                             -           -  1 015 212      949 754      12 913        8 118      571       4 169
                                                304 988     161 583                                486 667     509 459     1 194       5 683     6 740 683      6 181 412
Net claims incurred                                                       406 113      395 799
Acquisition costs                                  5 923       5 962      183 999      178 651     260 391     285 656       217      (1 589)    3 279 979      3 130 979
Interest allocated to cell owners               256 150     120 826                                171 123     174 372       240       4 832         34 634         28 744
Employee benefit expense                                                            -           -                            466          436                -              -
Management and other expenses                            -           -              -           -           -           -                     -              -              -
Total expenses                                           -           -    150 229      152 371              -           -        -        391
                                                 15 014      12 492       740 341      726 821      42 725      35 788       327       4 070     1 451 545      1 296 148
                                                277 087     139 280                                474 239     495 816     1 250                 4 766 158      4 455 871

Net profit/(loss) before taxation               27 901      22 303      274 871        222 933     12 428      13 643          (56)    1 613     1 974 525      1 725 541
Taxation                                         7 397       6 292       74 698         59 664      3 143       3 818            16       597      572 458        511 497
Net profit/(loss) after taxation                                                                    9 285       9 825
Other comprehensive income/(expense)            20 504      16 011      200 173        163 269      2 423       5 047          (40)     1 016    1 402 067      1 214 044
Total comprehensive income/(loss) for the year          -           -            -              -                                  -          -      13 451         24 486
Transfer to/(from) retained earnings                                                               11 708      14 872
Other comprehensive (income)/expense            20 504      16 011      200 173        163 269             -           -       (40)     1 016    1 415 518      1 238 530
Dividends                                               -           -            -              -                                  -          -    (13 451)       (24 012)
Change in retained earnings                             -           -            -              -  (2 423)     (5 047)             -          -              -              -
                                                        -           -                                  679         679
                                                                         50 000         50 000                               4 000      4 000    1 029 000      1 063 250
                                                20 504      16 011      150 173        113 269      8 606       9 146      (4 040)    (2 984)      399 969        199 292

Net premium to gross premium                     2%          1%         88%            88%          33%         33%            N/A        N/A    99%            98%
Claims incurred to earned premium               14%         24%         46%            46%          78%         77%         (53%)     (633%)     51%            53%
Management and other expenses to net earned     37%         51%         17%            18%          13%         10%         (80%)                22%            22%
premium                                                                                                                                156%
Combined ratio                                  57%         86%         82%            84%         105%        102%        (191%)                73%            75%
Operating ratio                                 32%          9%         73%            78%         100%         99%           61%     1448%      70%            71%
Return on equity                                12%                     26%            26%                        5%          (1%)     945%      48%            48%
                                                            11%                                       5%                                 14%
   112   113   114   115   116   117   118   119   120   121   122