
Page 114 - MC14326 all pages
P. 114
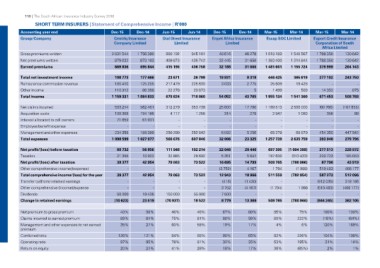
110 | The South African Insurance Industry Survey 2016

SHORT TERM INSURERS | Statement of Comprehensive Income | R’000

Accounting year end                             Dec-15               Dec-14         Jun-15       Jun-14      Dec-15     Dec-14       Mar-15         Mar-14           Mar-15        Mar-14
Group/Company
                                                Centriq Insurance                   Dial Direct Insurance    Enpet Africa Insurance  Escap SOC Limited               Export Credit Insurance
                                                Company Limited                              Limited                   Limited                                        Corporation of South
                                                                                                                                                                           Africa Limited

Gross premiums written                          2 031 544            1 756 380      900 192      945 161     48 616     46 278       1 618 189      1 540 567        1 788 350     130 642
Net premiums written                              879 032              873 103      409 873      436 742     32 445     31 650       1 383 400      1 214 844
Earned premiums                                   669 836              695 844      415 196      436 758     32 188     31 666       1 481 601      1 155 724        1 788 350     130 642

                                                                                                                                                                     379 999       264 143

Total net investment income                       198 773              177 466       23 671       26 799     18 831      9 319         446 425        365 619        277 102       243 750
Reinsurance commission revenue                    180 410              125 255      217 479      225 630      3 033      2 775           25 609         19 428                -             -
Other income                                      110 312                                                            -                    1 499             589
Total income                                    1 159 331                86 268      22 278       20 873                       5                                      14 352            875
                                                                     1 084 833      678 624      710 060     54 052     43 765       1 955 134      1 541 360        671 453       508 768

Net claims incurred                               593 214              582 461      312 279      353 738     25 600     17 790       1 189 513      2 566 000        (60 766)      (167 835)
Acquisition costs                                 199 368              194 186         4 117        1 266        314        279           2 947          1 080            356               89
Interest allocated to cell owners                                                            -            -          -          -                -              -             -               -
Employee benefit expense                            71 659               61 931              -            -          -          -                -              -             -               -
Management and other expenses                               -                    -
Total expenses                                                                      250 280      252 842      6 092      5 256           65 279         68 679       454 350        447 542
                                                  234 358              189 399      566 676      607 846     32 006     23 325       1 257 739      2 635 759        393 940        279 796
                                                1 098 599            1 027 977

Net profit/(loss) before taxation                        60 732      56 856         111 948      102 214     22 046     20 440       697 395        (1 094 399)       277 513       228 972
Taxation                                                 21 355      13 902          32 885       28 692      5 351      5 641       187 630          (313 433)       209 723       185 053
Net profit/(loss) after taxation                         39 377      42 954          79 063       73 522                             509 765          (780 966)
Other comprehensive income/(expense)                                                          -           -  16 695     14 799                            (1 988)       67 790        43 919
Total comprehensive income/(loss) for the year                    -          -       79 063       73 522     (3 752)     4 167          1 794         (782 954)       519 483       468 177
Transfer to/(from) retained earnings                     39 377      42 954                   -           -  12 943                  511 559                      -   587 273       512 096
Other comprehensive (income)/expense                                                          -           -             18 966                             1 988     (912 035)      318 186
Dividends                                                         -          -                    55 000       (416)    (1 430)               -                   -  (519 483)     (468 177)
Change in retained earnings                                       -          -      150 000       18 522      3 752     (4 167)       (1 794)         (780 966)
                                                          50 000     19 435         (70 937)                  7 500                                                             -             -
                                                        (10 623)     23 519                                   8 779             -             -                      (844 245)      362 105
                                                                                                                        13 369       509 765

Net premium to gross premium                             43%          50%           46%          46%         67%        68%          85%             79%             100%          100%
Claims incurred to earned premium                        89%          84%           75%          81%         80%        56%          80%            222%             (16%)         (64%)
Management and other expenses to net earned              35%          27%           60%          58%         19%        17%                                          120%          169%
premium                                                                                                                               4%               6%
Combined ratio                                          126%         121%           84%          88%         90%        65%                                          104%          106%
Operating ratio                                          97%          95%           78%          81%         32%        35%          83%            226%              31%           14%
Return on equity                                         20%          21%           41%          28%         18%        17%          53%            195%                2%            1%
                                                                                                                                     36%            (85%)