
Page 119 - MC14326 all pages
P. 119
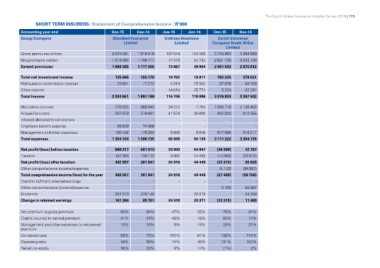
The South African Insurance Industry Survey 2016 | 115

SHORT TERM INSURERS | Statement of Comprehensive Income | R’000

Accounting year end                             Dec-15         Dec-14         Jun-15     Jun-14     Dec-15         Dec-14
Group/Company
                                                Standard Insurance            Unitrans Insurance        Zurich Insurance
                                                        Limited                       Limited       Company South Africa

                                                                                                              Limited

Gross premiums written                          2 070 591      1 918 416      167 544    154 483    3 735 903 3 484 869
Net premiums written                            1 919 085      1 796 717       77 979     54 734
Earned premiums                                 1 888 365      1 777 305       73 867     48 904    2 821 730 2 832 790

                                                                                                    2 801 503 2 875 812

Total net investment income                       125 685        103 170       19 702     19 911      182 225        379 531
Reinsurance commission revenue                      20 601         17 272        8 319    15 500        87 876         89 768
Other income                                                -             1               25 771         5 220         22 391
Total income                                                                   14 818    110 086
                                                2 034 651      1 897 748      116 706               3 076 824      3 367 502

Net claims incurred                               776 325        869 442      34 272      7 794     1 830 716      2 126 463
Acquisition costs                                 297 878        274 481      41 678     38 699       602 820        612 055
Interest allocated to cell owners                                                                               -              -
Employee benefit expense                                    -              -          -          -              -              -
Management and other expenses                       99 639         74 608             -          -    677 686        616 217
Total expenses                                    180 492        178 204       6 856      8 646
                                                1 354 334      1 396 735      82 806     55 139     3 111 222      3 354 735

Net profit/(loss) before taxation               680 317        501 013        33 900     54 947     (34 398)         12 767
Taxation                                        187 360        139 172         8 982     14 498     (12 083)       (23 072)
Net profit/(loss) after taxation                492 957        361 841                   40 449     (22 315)
Other comprehensive income/(expense)                                          24 918                                 35 839
Total comprehensive income/(loss) for the year           -              -             -          -    (5 153)      (94 997)
Transfer to/(from) retained earnings            492 957        361 841                   40 449     (27 468)       (59 158)
Other comprehensive (income)/expense                                          24 918
Dividends                                                -              -             -          -            -              -
Change in retained earnings                              -              -             -          -     5 153         94 997
                                                331 573        276 140                -  20 078                      24 359
                                                161 384         85 701                   20 371               -      11 480
                                                                              24 918                (22 315)

Net premium to gross premium                    93%            94%             47%       35%         76%            81%
Claims incurred to earned premium               41%            49%             46%       16%         65%            74%
Management and other expenses to net earned     10%            10%                       18%         24%            21%
premium                                                                          9%
Combined ratio                                  65%            73%                       81%        108%           114%
Operating ratio                                 59%            68%            101%       40%        101%           100%
Return on equity                                36%            30%             74%       14%
                                                                                 8%                  (1%)             2%