
Page 111 - MC14326 all pages
P. 111
The South African Insurance Industry Survey 2016 | 107
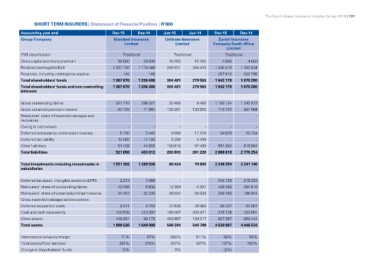
SHORT TERM INSURERS | Statement of Financial Position | R’000
Accounting year end Dec-15 Dec-14 Jun-15 Jun-14 Dec-15 Dec-14
Group/Company
Standard Insurance Unitrans Insurance Zurich Insurance
Limited Limited Company South Africa
Limited
FSB classification Traditional Traditional Traditional
Share capital and share premium
Retained earnings/(deficit) 30 000 30 000 15 150 15 150 4 650 4 650
Reserves, including contingency reserve
Total shareholders' funds 1 337 730 1 176 346 289 331 264 413 1 340 519 1 362 834
Total shareholders' funds and non-controlling
interests 140 140 -- 297 010 302 796
1 367 870 1 206 486 304 481 279 563 1 642 179 1 670 280
1 367 870 1 206 486 304 481 279 563 1 642 179 1 670 280
Gross outstanding claims 327 710 299 327 33 458 8 466 1 183 154 1 242 672
Gross unearned premium reserve 82 728 71 882 135 281 133 553 719 731 587 984
Reinsurers' share of expected salvages and - - - -
recoveries - -
Owing to cell owners - - - -
Deferred reinsurance commission revenue 5 705 5 445 - - 34 629 25 754
Deferred tax liability 14 080 12 103 9 089 17 219
Other liabilities 91 433 44 855 5 359 - -
Total liabilities 521 656 433 612 100 616 4 499 951 304 919 844
283 803 97 489 2 888 818 2 776 254
261 226
Total investments including investments in 1 551 393 1 280 566 86 424 79 805 2 246 354 2 241 146
subsidiaries
Deferred tax asset, intangible assets and PPE 2 273 1 068 - - 345 739 278 223
Reinsurers' share of outstanding claims 42 998 6 832 12 364 5 307 428 562 394 819
Reinsurers' share of unearned premium reserve 34 452 31 299 58 554 60 939 298 463 186 944
Gross expected salvages and recoveries
Deferred acquisition costs - - - - - -
Cash and cash equivalents 9 011 8 758 37 828 39 950 88 207 62 067
Other assets 100 538 213 397 189 207 200 471 315 705 432 891
Total assets 148 861 98 178 203 907 154 317 807 967 850 444
1 889 526 1 640 098 588 284 540 789 4 530 997 4 446 534
International solvency margin 71% 67% 390% 511% 58% 59%
Total assets/Total liabilities 362% 378% 207% 207% 157% 160%
Change in shareholders' funds
13% 9% (2%)