
Page 115 - MC14326 all pages
P. 115
The South African Insurance Industry Survey 2016 | 111
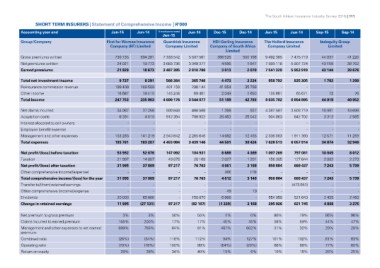
SHORT TERM INSURERS | Statement of Comprehensive Income | R’000
Accounting year end Jun-15 Jun-14 15 month period ended Jun-14 Dec-15 Dec-14 Jun-15 Jun-14 Sep-15 Sep-14
Group/Company
Jun-15
Gross premiums written
Net premiums written First for Women Insurance Guardrisk Insurance HDI-Gerling Insurance The Hollard Insurance Indequity Group
Earned premiums Company (RF) Limited Company Limited Company of South Africa Company Limited Limited
Limited
730 735 694 281 7 333 542 5 507 561 388 526 500 198 9 492 385 7 475 719 44 937 41 220
24 021 19 773 3 683 738 3 049 377 7 593 118 5 907 724 43 158 39 702
21 929 18 673 3 487 385 2 810 786 4 586 1 847 7 541 329 5 953 919 43 144 39 676
3 013 2 070
Total net investment income 9 737 8 291 566 384 365 746 4 473 3 234 958 792 835 305 1 703 1 200
Reinsurance commission revenue 199 400 189 589 401 159 298 144 41 654 35 799 - - - -
Other income 145 248
Total income 16 687 19 410 4 600 176 69 401 2 049 1 690 135 661 65 671 72 76
247 753 235 963 3 544 077 51 189 42 793 8 635 782 6 854 895 44 919 40 952
Net claims incurred 34 087 37 258 599 848 466 568 1 366 927 4 387 587 3 503 719 18 991 18 696
Acquisition costs 6 391 4 810 912 394 706 932 28 453 25 042 904 863 642 702 3 312 2 985
Interest allocated to cell owners - - - - - -
Employee benefit expense - - - - - - - - - -
Management and other expenses - - - -
Total expenses 153 283 141 219 2 940 842 2 265 646 14 682 12 455 2 336 063 1 911 393 12 571 11 259
193 761 183 287 4 453 084 3 439 146 44 501 38 424 7 628 513 6 057 814 34 874 32 940
Net profit/(loss) before taxation 53 992 52 676 147 092 104 931 6 688 4 369 1 007 269 797 081 10 045 8 012
Taxation 21 997 14 807 49 875 28 168 2 027 1 201 156 385 127 644 2 802 2 273
Net profit/(loss) after taxation 31 995 37 869 97 217 76 763 4 661 3 168 850 884 669 437 7 243 5 739
Other comprehensive income/(expense) - - - -
Total comprehensive income/(loss) for the year - - 97 217 76 763 (49) (19) 850 884 - 7 243 -
Transfer to/(from) retained earnings 31 995 37 869 - - 4 612 3 149 - 669 437 - 5 739
Other comprehensive (income)/expense - - - (473 951) -
Dividends - - - - - 554 958 2 435 -
Change in retained earnings - - 97 217 158 870 49 19 295 926 - 4 808 -
20 000 65 000 (82 107) 6 000 521 643 2 463
11 995 (27 131) (1 339) - 621 745 3 276
3 168
Net premium to gross premium 3% 3% 50% 55% 1% 0% 80% 79% 96% 96%
Claims incurred to earned premium 155% 200% 17% 17% 45% 45% 58% 59% 44% 47%
Management and other expenses to net earned 699% 756% 84% 81% 487% 602% 31% 32% 29% 28%
premium
Combined ratio (26%) (34%) 116% 112% 94% 127% 101% 102% 81% 83%
Operating ratio (70%) (78%) 100% 99% (54%) (29%) 88% 88% 77% 80%
Return on equity 40% 19% 16% 26% 25%
29% 38% 34% 10% 6%