Page 118 - MC14326 all pages
P. 118

114 | The South African Insurance Industry Survey 2016

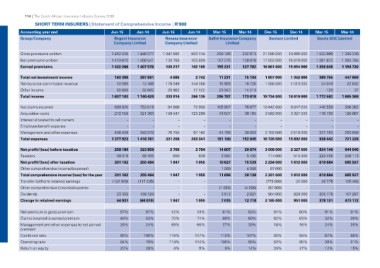
SHORT TERM INSURERS | Statement of Comprehensive Income | R’000

Accounting year end                             Jun-15         Jun-14         Jun-15      Jun-14      Mar-15      Mar-14        Dec-15           Dec-14          Mar-15         Mar-14
Group/Company
                                                Regent Insurance              Renasa Insurance        Safire Insurance Company  Santam Limited                   Sasria SOC Limited
                                                Company Limited               Company Limited                      Limited

Gross premiums written                          1 452 028      1 448 377      1 047 582   803 114     259 189     232 813       21 085 000       19 866 000      1 522 866      1 390 338
Net premiums written                            1 413 670      1 408 541        130 785   102 839     157 275     128 870       17 003 000       15 879 000      1 381 872      1 263 765
Earned premiums                                 1 432 266      1 407 576        130 217   102 105     155 231     127 782       16 861 000       15 654 000      1 358 649      1 194 730

Total net investment income                       163 380        287 691         4 686       2 742     11 231      15 104        1 807 000        1 352 000        389 755        447 969
Reinsurance commission revenue                      10 589         12 488     178 049     144 166      15 983      16 720        1 066 000        1 013 000          24 049         22 632
Other income                                        30 868         32 665                              23 342      14 213                                                129             37
Total income                                                                   20 962      17 122     205 787     173 819                    -                -
                                                1 637 103      1 740 420      333 914     266 135                               19 734 000       18 019 000      1 772 582      1 665 368
Net claims incurred                                                                                   105 907
Acquisition costs                                 699 326        752 019       94 906      72 900      43 507      76 677       10 442 000        9 847 000        440 559        306 382
Interest allocated to cell owners                 272 158        321 363      159 547     123 299              -   38 165        3 582 000        3 327 000        176 730        120 987
Employee benefit expense                                                                                       -                             -
Management and other expenses                               -              -           -           -   41 766              -                  -               -              -              -
Total expenses                                              -              -           -           -                       -     2 702 000                    -              -              -
                                                  406 439        343 379       76 755      67 142     191 180      38 003                         2 518 000        321 153        293 959
                                                1 377 923      1 416 761      331 208     263 341                 152 845       16 726 000       15 692 000        938 442        721 328

Net profit/(loss) before taxation                259 180        323 659       2 706       2 794       14 607      20 974        3 008 000        2 327 000       834 140        944 040
Taxation                                           58 018         68 165        859         839        3 980       5 435          714 000          515 000       223 456        258 113
Net profit/(loss) after taxation                                                                                                                                 610 684        685 927
Other comprehensive income/(expense)             201 162        255 494       1 847       1 955       10 627      15 539        2 294 000        1 812 000
Total comprehensive income/(loss) for the year             -              -         -           -      1 069       4 599            97 000                   -            -              -
Transfer to/(from) retained earnings                                                                                                                             610 684        685 927
Other comprehensive (income)/expense             201 162        255 494       1 847       1 955       11 696      20 138        2 391 000        1 812 000                      105 468
Dividends                                       (132 929)      (117 435)            -           -             -           -     (775 000)            32 000       26 775
Change in retained earnings                                                         -           -                                                            -            -              -
                                                           -              -         -           -     (1 069)     (4 599)         (97 000)                                      107 287
                                                   23 302       198 129                                3 612       2 821          904 000          829 000       205 778        473 172
                                                   44 931       (60 070)      1 847       1 955        7 015                    2 165 000          951 000       378 131
                                                                                                                  12 718

Net premium to gross premium                            97%     97%            12%         13%         61%         55%          81%              80%             91%            91%
Claims incurred to earned premium                       49%     53%            73%         71%         68%         60%          62%              63%             32%            26%
Management and other expenses to net earned             28%     24%            59%         66%         27%         30%          16%              16%             24%            25%
premium
Combined ratio                                          95%    100%           118%        117%        113%        107%          93%              94%             67%            58%
Operating ratio                                         84%     79%           114%        114%        106%         95%          82%              85%             39%            21%
Return on equity                                        20%     28%                                                14%          30%              27%             12%            15%
                                                                                 4%          5%          9%
   113   114   115   116   117   118   119   120   121   122   123