Page 110 - MC14326 all pages
P. 110

106 | The South African Insurance Industry Survey 2016

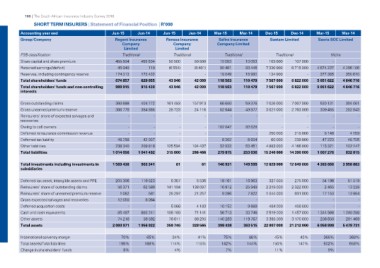
      SHORT TERM INSURERS | Statement of Financial Position | R’000

Accounting year end                            Jun-15         Jun-14         Jun-15      Jun-14       Mar-15      Mar-14       Dec-15          Dec-14          Mar-15         Mar-14
Group/Company
                                               Regent Insurance              Renasa Insurance          Safire Insurance        Santam Limited                  Sasria SOC Limited
FSB classification                                  Company                       Company             Company Limited
Share capital and share premium                      Limited                        Limited
Retained earnings/(deficit)
Reserves, including contingency reserve        Traditional                   Traditional              Traditional              Traditional                             Niche
Total shareholders' funds
Total shareholders' funds and non-controlling  455 504        455 504        50 500       50 500      10 053       10 053      103 000         107 000                 --
interests
                                               45 040            119         (6 554)      (8 401)     90 461       83 446      7 330 000 6 715 000             4 674 237 4 296 106

                                               174 313        173 432                --               18 049       16 980      134 000                 -       377 385        350 610

                                               674 857        629 055        43 946       42 099      118 563      110 479     7 567 000 6 822 000             5 051 622 4 646 716

                                               989 915        915 430        43 946       42 099      118 563      110 479     7 567 000 6 822 000             5 051 622 4 646 716

Gross outstanding claims                         360 688        404 772      161 483      157 913      66 650      59 376      7 026 000       7 007 000         530 131      394 061
Gross unearned premium reserve                   366 770        384 865       28 723       24 116      52 844      49 977      3 021 000       2 763 000         309 455      282 943
Reinsurers' share of expected salvages and                                            -            -
recoveries                                                 -              -                                    -           -               -               -               -           -
Owing to cell owners                                                                  -            -
Deferred reinsurance commission revenue                    -              -           -            -  102 047       83 628                  -               -              -           -
Deferred tax liability                                     -              -           -            -           -            -      250 000         215 000          5 146        4 159
Other liabilities                                  48 258         42 037     125 594      104 437                                                  239 000         47 223      48 705
Total liabilities                                238 340        209 818      315 800      286 466        6 302        6 604         60 000      4 166 000        115 321      102 147
                                               1 014 056      1 041 492                                52 032       53 451      4 883 000      14 390 000      1 007 276      832 015
                                                                                                      279 875      253 036     15 240 000

Total investments including investments in     1 569 438      903 341                61          61 146 931 149 599 12 829 000 12 649 000 4 383 666 3 958 863
subsidiaries

Deferred tax asset, intangible assets and PPE    205 306        119 523         6 357        5 536     18 161       16 963         327 000         275 000         54 198         51 019
Reinsurers' share of outstanding claims            56 371         62 580     141 194      138 097      16 912       25 949      2 219 000       2 322 000           2 465         13 228
Reinsurers' share of unearned premium reserve       1 082             581                                                       1 044 000                                         13 864
Gross expected salvages and recoveries             12 059          8 064      25 297       21 257        9 286        7 822                        931 000         17 153
Deferred acquisition costs                                 -              -           -            -           -            -               -               -              -              -
Cash and cash equivalents                          85 497                                                                          484 000                                 -              -
Other assets                                       74 218       803 241         5 066        4 183     10 152         9 669     2 519 000          408 000                    1 240 288
Total assets                                                      59 592     105 160       71 141      56 713       33 746      3 385 000       1 457 000      1 344 566        201 469
                                               2 003 971                                   88 290     140 283      119 767     22 807 000       3 170 000        256 850      5 478 731
                                                              1 956 922       76 611      328 565     398 438      363 515                     21 212 000
                                                                             359 746                                                                           6 058 898

International solvency margin                   70%            65%            34%          41%         75%          86%         45%             43%            366%           368%
Total assets/Total liabilities                 198%           188%           114%         115%        142%         144%        150%            147%            602%           658%
Change in shareholders' funds
                                                  8%                            4%                       7%                     11%                               9%
   105   106   107   108   109   110   111   112   113   114   115