Page 106 - MC14326 all pages
P. 106

102 | The South African Insurance Industry Survey 2016

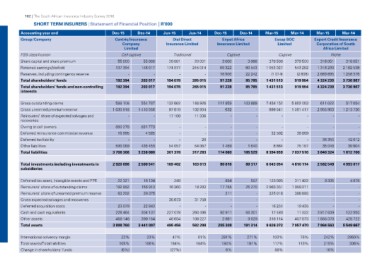
     SHORT TERM INSURERS | Statement of Financial Position | R’000

Accounting year end                            Dec-15         Dec-14         Jun-15      Jun-14       Dec-15        Dec-14      Mar-15         Mar-14           Mar-15         Mar-14
Group/Company
                                               Centriq Insurance                  Dial Direct             Enpet Africa          Escap SOC                       Export Credit Insurance
FSB classification                                  Company                  Insurance Limited        Insurance Limited           Limited                        Corporation of South
Share capital and share premium                       Limited                                                                                                         Africa Limited
Retained earnings/(deficit)
Reserves, including contingency reserve        Cell captive                  Traditional                   Captive                      Captive                         Niche
Total shareholders' funds                                                                              3 000
Total shareholders' funds and non-controlling  55 000         55 000         20 001       20 001      69 322         3 000      379 500          379 500        316 051        316 051
interests                                                                                             18 906        60 543
                                               137 394        148 017        174 077      245 014     91 228        22 242      1 053 027        543 262        1 318 293 2 162 538
                                                                                                      91 228        85 785
                                                       --                            --                             85 785      (1 014)          (2 808)        2 689 895 1 258 378

                                               192 394        203 017        194 078      265 015                               1 431 513        919 954        4 324 239 3 736 967

                                               192 394        203 017        194 078      265 015                               1 431 513        919 954        4 324 239 3 736 967

Gross outstanding claims                         588 108        554 707      132 602      148 926     111 959       103 889     7 454 152        5 862 063        611 022        517 054
Gross unearned premium reserve                 1 630 918      1 410 556       97 610      102 934          632               -    899 541        1 061 417      2 955 903      1 213 730
Reinsurers' share of expected salvages and                                    17 109                           -             -              -
recoveries                                                 -              -                11 336                                                            -              -              -
Owing to cell owners                                                                  -                        -             -              -
Deferred reinsurance commission revenue          880 276        831 773               -            -           -             -      32 502                   -              -              -
Deferred tax liability                             16 995          4 585              -            -           -             -                       38 869                 -              -
Other liabilities                                          -              -   54 057             20      1 489         1 640                -                       38 350         42 012
Total liabilities                                                            301 378       54 067     114 080       105 529          8 664                   -      35 049         39 904
                                                 590 069        436 459                   317 283                               8 394 859            75 167     3 640 324      1 812 700
                                               3 706 366      3 238 080                                                                          7 037 516

Total investments including investments in     2 920 696 2 500 541           169 402      163 613     90 616        89 317 6 043 054 4 810 114 2 582 549 4 993 017
subsidiaries

Deferred tax asset, intangible assets and PPE      22 321         18 134          249              -       854           597      123 095          311 422           9 305          4 978
Reinsurers' share of outstanding claims          192 852        156 913       16 360       18 203      17 755        25 270     2 983 351        1 959 211                  -              -
Reinsurers' share of unearned premium reserve                                                                                                                               -              -
Gross expected salvages and recoveries             63 202         39 375              -            -       311               -    325 018          388 693                  -              -
Deferred acquisition costs                                 -              -   35 673       31 759              -             -              -                -              -              -
Cash and cash equivalents                                                                                      -             -
Other assets                                       23 079         22 843              -            -                 66 301         16 251           19 435     3 817 639        122 950
Total assets                                     226 464        304 137      227 078      260 496      92 911          9 829        17 489           11 522     1 555 070        428 722
                                                 450 146        399 154                   108 227        2 861      191 314       318 114          457 073      7 964 563      5 549 667
                                               3 898 760      3 441 097       46 694      582 298                               9 826 372        7 957 470
                                                                             495 456                  205 308

International solvency margin                   22%            23%            47%          61%        281%          271%        103%              76%           242%           2860%
Total assets/Total liabilities                 105%           106%           164%         184%        180%          181%        117%             113%           219%            306%
Change in shareholders' funds                                                (27%)
                                                (5%)                                                     6%                      56%                             16%
   101   102   103   104   105   106   107   108   109   110   111