
Page 108 - MC14326 all pages
P. 108
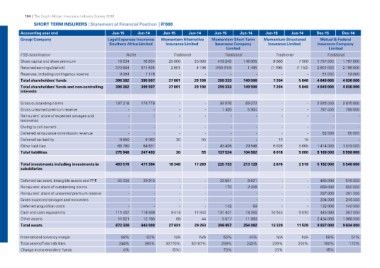
104 | The South African Insurance Industry Survey 2016

      SHORT TERM INSURERS | Statement of Financial Position | R’000

Accounting year end                            Jun-15         Jun-14      Jun-15      Jun-14         Jun-15      Jun-14       Jun-15     Jun-14       Dec-15     Dec-14
Group/Company
                                               Legal Expenses Insurance   Momentum Alternative       Momentum Short Term      Momentum Structured      Mutual & Federal
                                                Southern Africa Limited      Insurance Limited         Insurance Company         Insurance Limited    Insurance Company
                                                                                                                Limited
                                                                                                                                                              Limited

FSB classification                                     Niche                 Traditional             Traditional              Traditional             Traditional
Share capital and share premium                 16 634                    25 000
Retained earnings/(deficit)                    370 664         16 634                     25 000     419 246      148 005     9 000        7 000      1 797 000 1 797 000
Reserves, including contingency reserve                       371 695      2 801           4 198
Total shareholders' funds                         9 084                           -               -  (159 913)    1 495       (1 796)      (1 152)    2 801 000 2 186 000
Total shareholders' funds and non-controlling  396 382           7 178
interests                                      396 382        395 507     27 801          29 198             --                       --              51 000       53 000
                                                              395 507     27 801          29 198
                                                                                                     259 333      149 500     7 204        5 848      4 649 000 4 036 000

                                                                                                     259 333      149 500     7 204        5 848      4 649 000 4 036 000

Gross outstanding claims                       197 318        174 779             -             - 92 676 69 072                       -             - 2 925 000 2 815 000

Gross unearned premium reserve                         - - - - 1 420 5 964 - - 787 000 799 000

Reinsurers' share of expected salvages and             ----------
recoveries

Owing to cell owners                                   ----------

Deferred reinsurance commission revenue                - - - - - - - - 62 000 65 000

Deferred tax liability                         9 850          8 083               30          55             -            - 11 15                             -          -

Other liabilities                              68 780         64 631              -             - 43 428 29 546               6 005        5 665 1 414 000 1 919 000

Total liabilities                              275 948        247 493             30          55 137 524 104 582              6 016        5 680 5 188 000 5 598 000

Total investments including investments in     493 578        471 384     18 348          17 269     225 733      213 129     2 676        2 518 5 192 000 5 548 000
subsidiaries

Deferred tax asset, intangible assets and PPE   55 334         39 915             -               -   33 851         8 621            -            -    485 000    516 000
Reinsurers' share of outstanding claims                 -              -          -               -       173        2 005            -            -    658 000    600 000
Reinsurers' share of unearned premium reserve           -              -          -               -           -                       -            -    287 000    281 000
Gross expected salvages and recoveries                  -              -          -               -           -            -          -            -    204 000    216 000
Deferred acquisition costs                              -              -          -               -       142              -          -            -    132 000    140 000
Cash and cash equivalents                                                  9 414          11 940                         69   10 544        9 010       445 000    367 000
Other assets                                   111 497        118 936          69              44    131 441       18 265             -            -  2 434 000  1 966 000
Total assets                                    11 921         12 765     27 831          29 253        5 517      11 993     13 220       11 528     9 837 000  9 634 000
                                                                                                                  254 082
                                               672 330        643 000                                396 857

International solvency margin                   58%            62%              N/A             N/A   50%          44%           N/A          N/A      58%          51%
Total assets/Total liabilities                 244%           260%        92770%          53187%     289%         243%        220%         203%       190%         172%
Change in shareholders' funds
                                                  0%                           (5%)                   73%                      23%                     15%