Page 105 - MC14326 all pages
P. 105

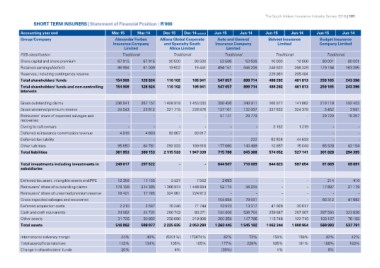
The South African Insurance Industry Survey 2016 | 101

SHORT TERM INSURERS | Statement of Financial Position | R’000

Accounting year end                            Mar-15      Mar-14       Dec-15         Dec-14 restated  Jun-15         Jun-14         Jun-15         Jun-14         Jun-15      Jun-14
Group/Company
                                                Alexander Forbes        Allianz Global Corporate         Auto and General             Bidvest Insurance             Budget Insurance
FSB classification                             Insurance Company           and Specialty South          Insurance Company                    Limited                Company Limited
Share capital and share premium                                                Africa Limited
Retained earnings/(deficit)                            Limited                                                  Limited
Reserves, including contingency reserve
Total shareholders' funds                      Traditional              Traditional                     Traditional                   Traditional                   Traditional
Total shareholders' funds and non-controlling
interests                                      67 915       67 915      90 500         90 500           53 506         53 506         10 000         10 000         80 001       80 001

                                               86 994       61 009      19 602         15 441           494 151        846 208        248 931        266 329        179 164      163 395

                                                       --                       --                              --                    229 361        205 484                --

                                               154 909      128 924     110 102        105 941          547 657        899 714        488 292        481 813        259 165      243 396

                                               154 909      128 924     110 102        105 941          547 657        899 714        488 292        481 813        259 165      243 396

Gross outstanding claims                       236 941      267 157     1 408 918      1 450 030        350 426        340 911        166 977        141 862        210 119      192 403
Gross unearned premium reserve                  24 543       23 612       321 715        226 876        137 161        132 007        337 532        324 379           5 452        3 581
Reinsurers' share of expected salvages and              -            -              -              -
recoveries                                                                                               51 141         28 779                 -              -      20 729       16 257
Owing to cell owners                                    -            -              -              -
Deferred reinsurance commission revenue           4 819        4 603        92 867         80 817                -              -        3 162          1 219                -            -
Deferred tax liability                                                                                           -              -              -              -              -            -
Other liabilities                                       -            -              -              -             -          222                                              -            -
Total liabilities                               95 650       84 781       292 033        189 616        177 060        143 469         52 524         44 633         65 528       82 154
                                               361 953      380 153     2 115 533      1 947 339        715 788        645 388         13 857         15 048        301 828      294 395
                                                                                                                                      574 052        527 141

Total investments including investments in     249 017      207 522             -                 - 644 507 710 009 644 823 587 654                                 81 869       69 691
subsidiaries

Deferred tax asset, intangible assets and PPE   12 358       11 155          5 527          7 552            2 693                 -              -              -       214          410
Reinsurers' share of outstanding claims        178 199      214 395     1 366 974      1 448 894            52 174         58 255                 -              -   17 897       21 179
Reinsurers' share of unearned premium reserve                                                                                                     -              -
Gross expected salvages and recoveries          18 491       17 785       324 061        224 813                    -              -              -              -           -            -
Deferred acquisition costs                              -            -              -              -      104 994          79 031         41 928         30 617      60 312       47 682
Cash and cash equivalents                                                                                                  13 317       259 847        267 967
Other assets                                      2 210        2 597        70 240         71 744           13 913       536 704        115 746        122 716               -            -
Total assets                                    24 862       24 731       200 743          80 371         184 806        147 786      1 062 344      1 008 954      297 594      322 636
                                                31 725       30 892       258 090        219 906          260 358      1 545 102                                    103 107
                                               516 862      509 077     2 225 635      2 053 280        1 263 445                                                   560 993       76 193
                                                                                                                                                                                 537 791

International solvency margin                   44%          40%        (5201%)        173674%           42%            72%           158%           159%            42%          42%
Total assets/Total liabilities                 143%         134%           105%             105%        177%           239%           185%           191%           186%         183%
Change in shareholders' funds                                                 4%                        (39%)
                                                20%                                                                                      1%                            6%
   100   101   102   103   104   105   106   107   108   109   110