Page 109 - MC14326 all pages
P. 109

The South African Insurance Industry Survey 2016 | 105

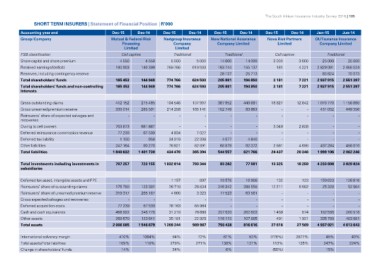
SHORT TERM INSURERS | Statement of Financial Position | R’000

Accounting year end                            Dec-15         Dec-14         Dec-15         Dec-14      Dec-15      Dec-14       Dec-15     Dec-14         Jun-15         Jun-14
Group/Company
                                               Mutual & Federal Risk         Nedgroup Insurance         New National Assurance   Nova Risk Partners        OUTsurance Insurance
FSB classification                                     Financing                    Company                 Company Limited              Limited              Company Limited
Share capital and share premium                          Limited                      Limited
Retained earnings/(deficit)
Reserves, including contingency reserve        Cell captive                  Traditional                Traditional               Cell captive             Traditional
Total shareholders' funds                                                                                                        3 000
Total shareholders' funds and non-controlling  4 550          4 550          5 000          5 000       14 000       14 000                     3 000      25 000         25 000
interests                                                                                                                          181          4 221
                                               160 903        140 399        769 766        619 593     163 744      155 137           -                   2 829 091 2 456 024
                                                                                                                                                      -
                                                       --                            --                 28 137       25 713      3 181          7 221      83 824         70 373
                                                                                                                                 3 181          7 221
                                               165 453        144 949        774 766        624 593     205 881      194 850                               2 937 915 2 551 397

                                               165 453        144 949        774 766        624 593     205 881      194 850                               2 937 915 2 551 397

Gross outstanding claims                         412 152        275 485      104 546        107 997     367 952      440 691     18 827         12 842     1 070 770      1 156 880
Gross unearned premium reserve                   339 014        285 591      214 258        165 141     102 749       83 863             -              -    431 052        449 356
Reinsurers' share of expected salvages and                                                                                    -          -              -              -              -
recoveries                                                 -              -           -              -           -
Owing to cell owners                                                                                                          -   3 049          2 808                 -              -
Deferred reinsurance commission revenue          763 873        681 887               -              -           -            -          -              -              -              -
Deferred tax liability                             77 239         67 539        4 834          7 027             -      4 840            -              -              -              -
Other liabilities                                   1 190             958     34 019         22 338        4 977      92 372                                 497 284        456 010
Total liabilities                                                 90 270      76 821         62 891      68 879      621 766      2 561          4 698     1 999 106      2 062 246
                                                 247 164                     434 478        365 394     544 557                  24 437         20 348
                                               1 840 632      1 401 730

Total investments including investments in     707 257        723 155 1 032 814             793 344     83 262       77 081      13 325         18 259 4 233 696 3 829 824
subsidiaries

Deferred tax asset, intangible assets and PPE              -              -       1 157          897     19 578       16 908         132            123      159 623        126 816
Reinsurers' share of outstanding claims          175 780        123 381          26 710      26 834     246 342      288 558     12 211          6 682         25 328         52 504
Reinsurers' share of unearned premium reserve    319 317        265 187                                                                                                -              -
Gross expected salvages and recoveries                                            4 000        3 323     77 523       63 581             -              -              -              -
Deferred acquisition costs                                 -              -              -           -           -            -          -              -              -              -
Cash and cash equivalents                          77 239         67 539                                         -            -          -              -
Other assets                                     456 922        246 776          78 163      65 984                               1 459             574      182 586        200 518
Total assets                                     269 570        120 641          31 219      76 680     207 620      262 603         491         1 931       335 788        403 981
                                               2 006 085      1 546 679          35 181      22 925     116 113      107 885     27 618         27 569     4 937 021      4 613 643
                                                                             1 209 244      989 987     750 438      816 616

International solvency margin                  410%           1064%           84%            72%         61%          53%        (776%)         2877%       45%            43%
Total assets/Total liabilities                 109%            110%          278%           271%        138%         131%         113%           135%      247%           224%
Change in shareholders' funds                                                                                                     (56%)
                                                14%                           24%                          6%                                               15%
   104   105   106   107   108   109   110   111   112   113   114