Page 107 - MC14326 all pages
P. 107

The South African Insurance Industry Survey 2016 | 103

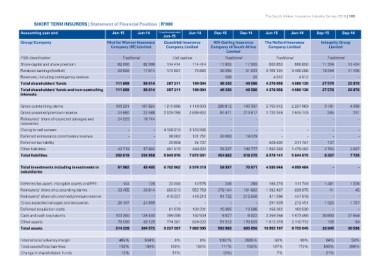
SHORT TERM INSURERS | Statement of Financial Position | R’000

Accounting year end                            Jun-15      Jun-14         15 month period ended  Jun-14         Dec-15      Dec-14       Jun-15         Jun-14         Sep-15     Sep-14

Group/Company                                                                Jun-15

FSB classification                             First for Women Insurance  Guardrisk Insurance                     HDI-Gerling Insurance  The Hollard Insurance         Indequity Group
Share capital and share premium                  Company (RF) Limited      Company Limited                      Company of South Africa    Company Limited                   Limited
Retained earnings/(deficit)
Reserves, including contingency reserve                                                                                     Limited
Total shareholders' funds
Total shareholders' funds and non-controlling  Traditional                Cell captive                          Traditional              Traditional                      Traditional
interests                                                                                                                                                              11 334
                                               82 000       82 000        114 414                114 414        17 955       17 955      606 850        606 850        16 244          11 434
                                                                                                                                                                                       11 436
                                               29 609       17 614        172 897                75 680         30 295       31 633      3 765 194 3 469 268                   -
                                                                                                                                                                       27 578                  -
                                                       --                 --                                    (50) (2)                 4 012          4 012          27 578          22 870
                                                                                                                                                                                       22 870
                                               111 609      99 614        287 311                190 094        48 200       49 586      4 376 056 4 080 130

                                               111 609      99 614        287 311                190 094        48 200       49 586      4 376 056 4 080 130

Gross outstanding claims                       109 291      107 824       1 210 696              1 118 933      280 812      193 397     2 755 612      2 207 963      3 181           4 398
Gross unearned premium reserve                  24 680       22 588       3 029 288              2 836 652       94 471      213 817     1 720 948      1 645 743        245             231
Reinsurers' share of expected salvages and      24 929       16 744                                                      -                                                   -               -
recoveries                                                                            -                      -                        -              -              -
Owing to cell owners                                    -            -                                                   -                                                   -               -
Deferred reinsurance commission revenue                 -            -    4 109 310              3 100 596       20 063               -              -              -        -               -
Deferred tax liability                                  -            -        98 063               101 751                    19 079                 -              -    137                 -
Other liabilities                               43 719       57 802           20 804                 24 737              -                 409 493        311 747      2 704           3 097
Total liabilities                              202 619      204 958                                489 832       59 337               -  1 693 088      1 479 462      6 267           7 726
                                                                            481 815                             454 683      189 777     6 579 141      5 644 915
                                                                          8 949 976              7 672 501                   616 070

Total investments including investments in     81 962       49 405 6 702 962 5 976 319                          58 997       70 871 4 595 046 4 099 484                        -                 -
subsidiaries

Deferred tax asset, intangible assets and PPE       144          126          33 000                 10 575          246          280        186 278      111 749       1 481           1 236
Reinsurers' share of outstanding claims         23 455       20 614         850 513                552 759      278 104      191 692      1 283 487       839 975           41              45
Reinsurers' share of unearned premium reserve                               416 227                416 210                   212 650                      447 678              -               -
Gross expected salvages and recoveries                  -            -                                           91 732                      471 094      272 451
Deferred acquisition costs                      26 197       24 809                   -                      -           -            -      291 538      169 530       1 525           1 707
Cash and cash equivalents                                                     61 078               100 201                    13 506         155 022    1 673 466              -               -
Other assets                                            -            -      399 206                182 509       15 365                   2 359 354     2 110 712
Total assets                                   103 380      126 493         774 301                624 022         6 927        6 022     1 613 378     9 725 045      30 693          27 554
                                                                          9 237 287              7 862 595                   170 635     10 955 197                        105              54
                                                79 090       83 125                                              51 512      665 656
                                               314 228      304 572                                             502 883                                                33 845          30 596

International solvency margin                  465%         504%             8%                     6%          1051%        2685%        58%            69%            64%             58%
Total assets/Total liabilities                 155%         149%          103%                   102%            111%         108%       167%           172%           540%            396%
Change in shareholders' funds                                                                                      (3%)
                                                12%                        51%                                                              7%                          21%
   102   103   104   105   106   107   108   109   110   111   112